Online Spectrogram Generator
Make a spectrogram online from any song, voice memo or field recording and see every frequency over time. Hover to read Hz, note and dB, switch to the live microphone, then save a sharp PNG. It all runs in your browser, so your audio never leaves your device.
- Free, no signup
- Live microphone mode
- PNG 1920 × 1080, 4K with Pro
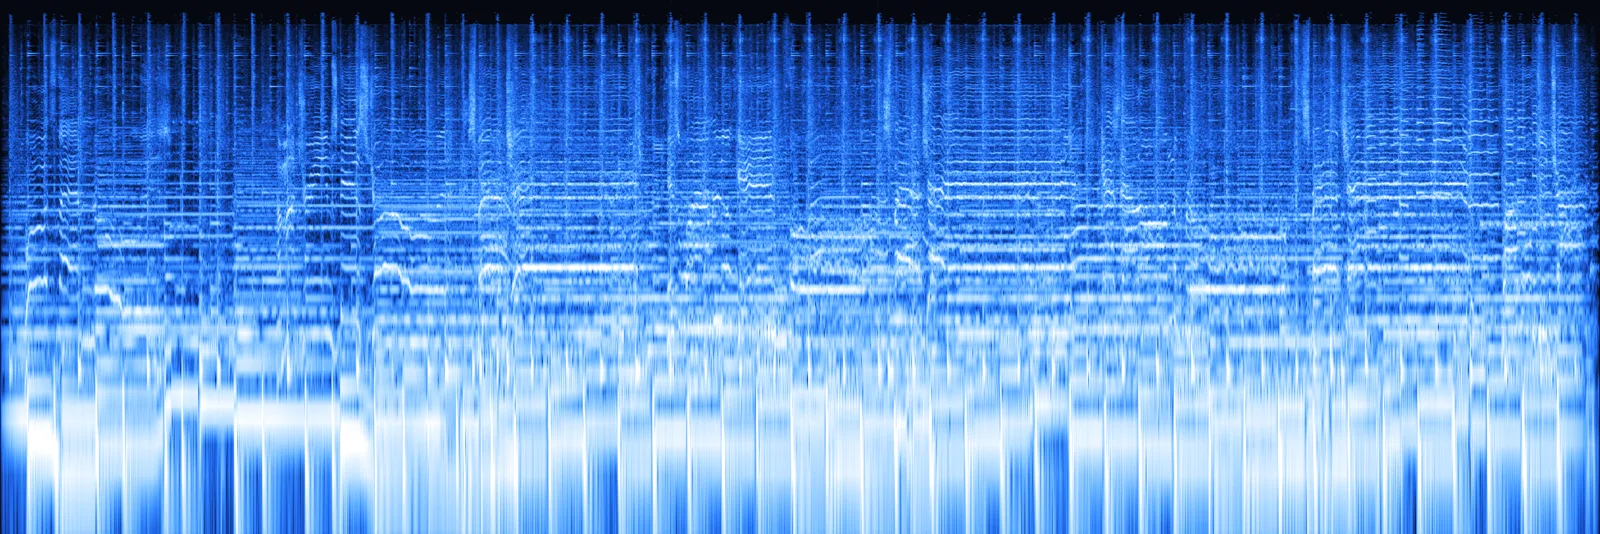
Spare Change (full mix)
46.4 ms window · 21.5 Hz bins
Or drop your own MP3, WAV, M4A, OGG or FLAC (up to 50 MB free, 500 MB with Pro). It is analysed in your browser and never uploaded.
Inspector
Built in
A pro spectrogram viewer that runs in one browser tab
Decoding, the FFT and the image export all happen on your device. These are the parts people reach for most.
- 0 uploadsAnalysed on your device, in this tab
- 100 MBLargest file you can drop: MP3, WAV, M4A, OGG, FLAC
- 10 minOf audio analysed per file, at full resolution
- 3840 × 2160Largest PNG export, with or without axes
Live microphone spectrogram
- 5 s
- 10 s
- 20 s
- Hz · note · dB
Read any point
- 0:07.4
- 587 Hz
- D5
- −22 dB
Hear what you see
- Space = play
- Click to seek
Long field recordings, full detail
- MP3
- WAV
- M4A
- OGG
- FLAC
Studio controls, plain numbers
Examples
Audio spectrogram examples, made with this tool
Every image below came out of the spectrogram generator above: one 30-second demo song and its stems, a blackbird recorded outdoors, and a clip that hides a picture. Each card lists its exact settings, so you can load them and make the same spectrogram online in one click.
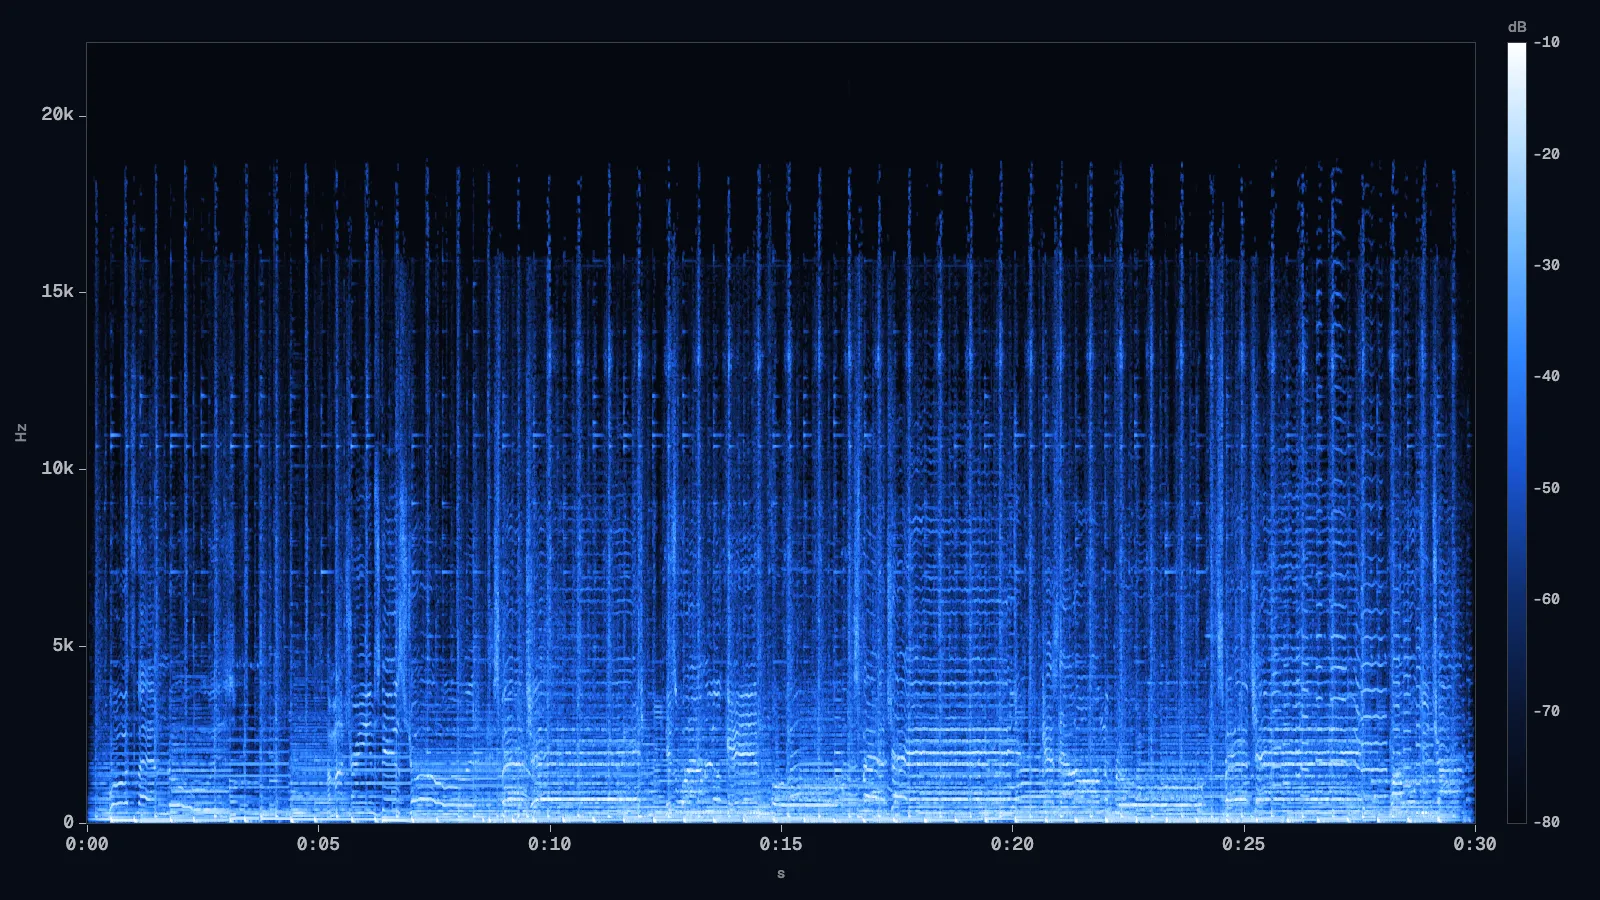
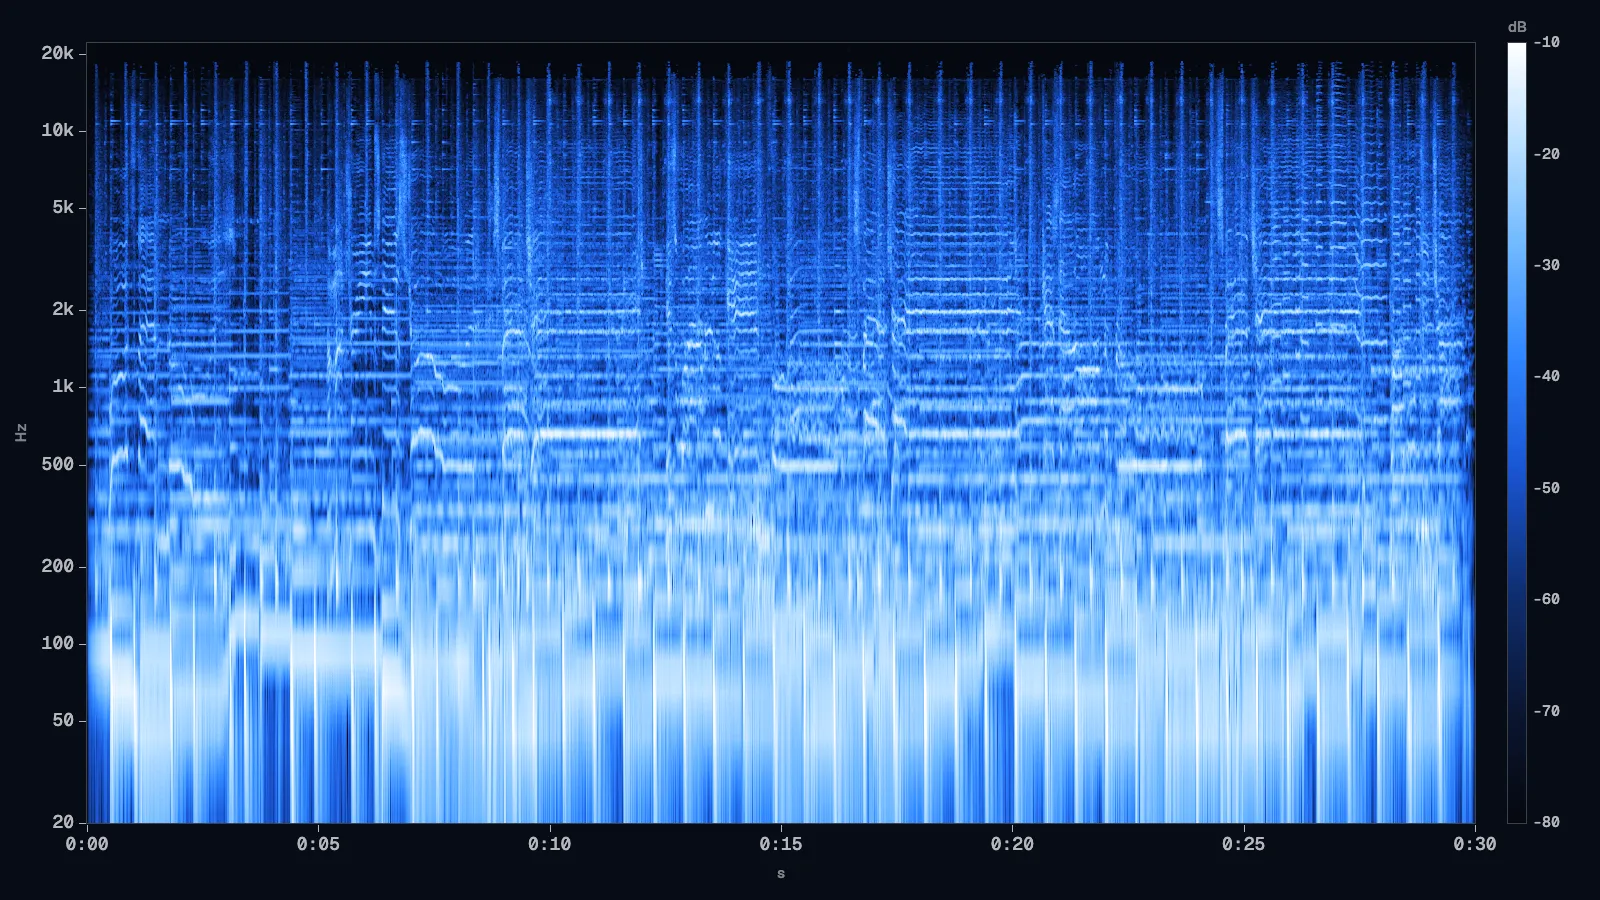
Linear vs log, same song
Drag the handle. Linear gives every kHz the same height, so bass and vocals squeeze into a thin strip at the bottom; log gives every octave the same height and the melody opens up.
- Full mix
- FFT 2048
- Linear ↔ Log
- Ice
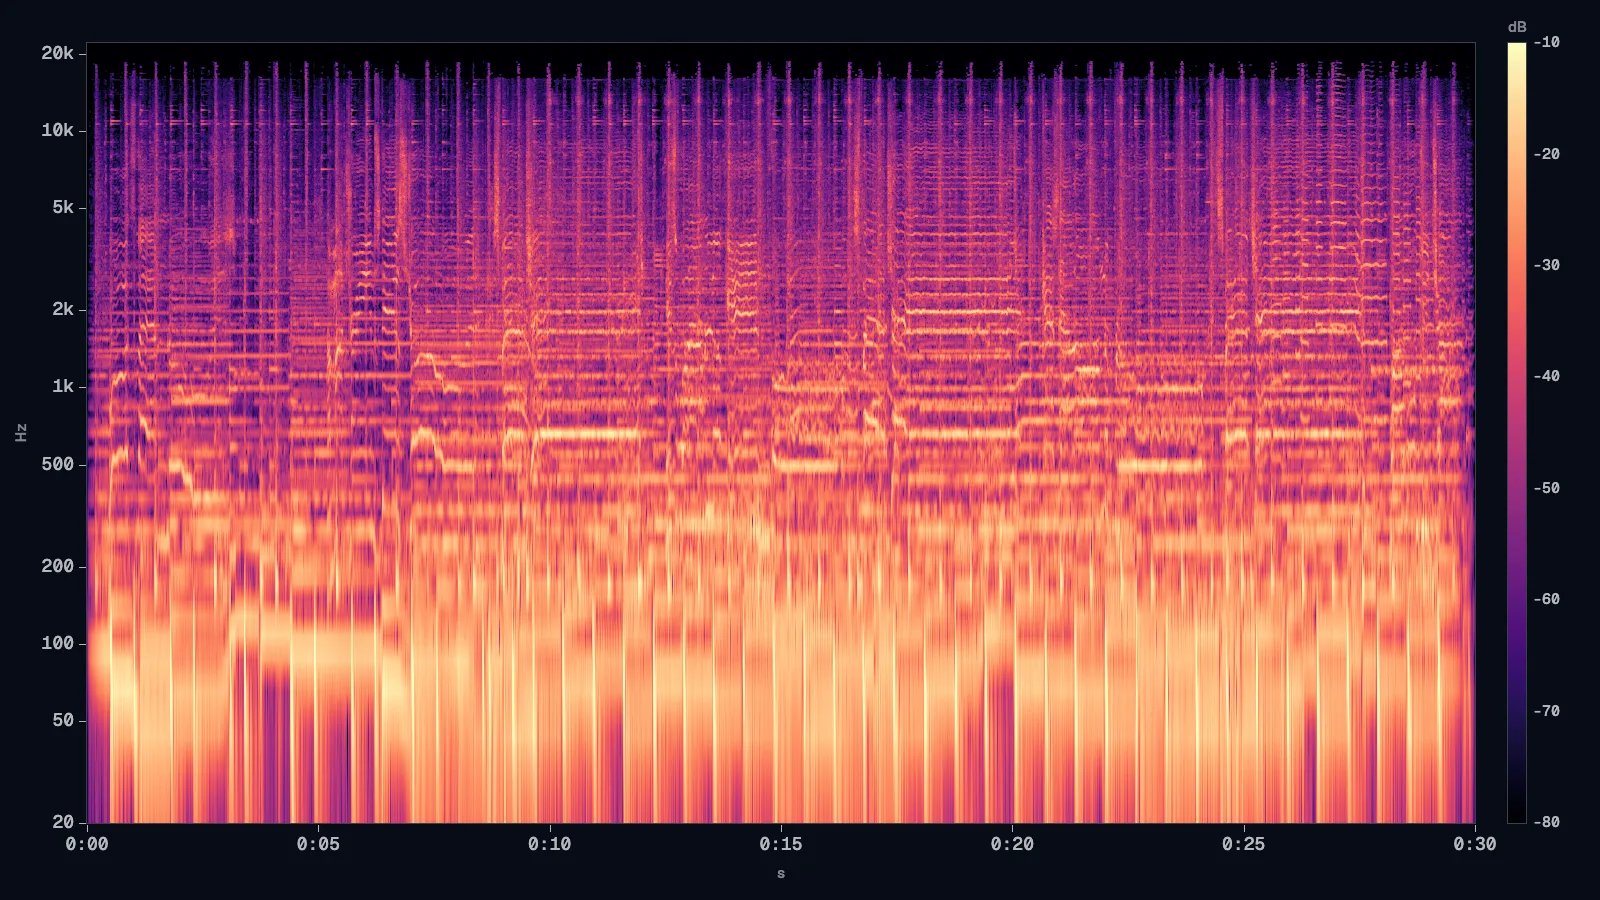
Magma vs ice, same data
Only the colour map changes. Magma is the classic in papers and audio apps; ice is our default, from night navy through brand blue to white, so harmonics stand out on a bright page.
- Full mix
- FFT 2048
- Log
- Magma ↔ Ice
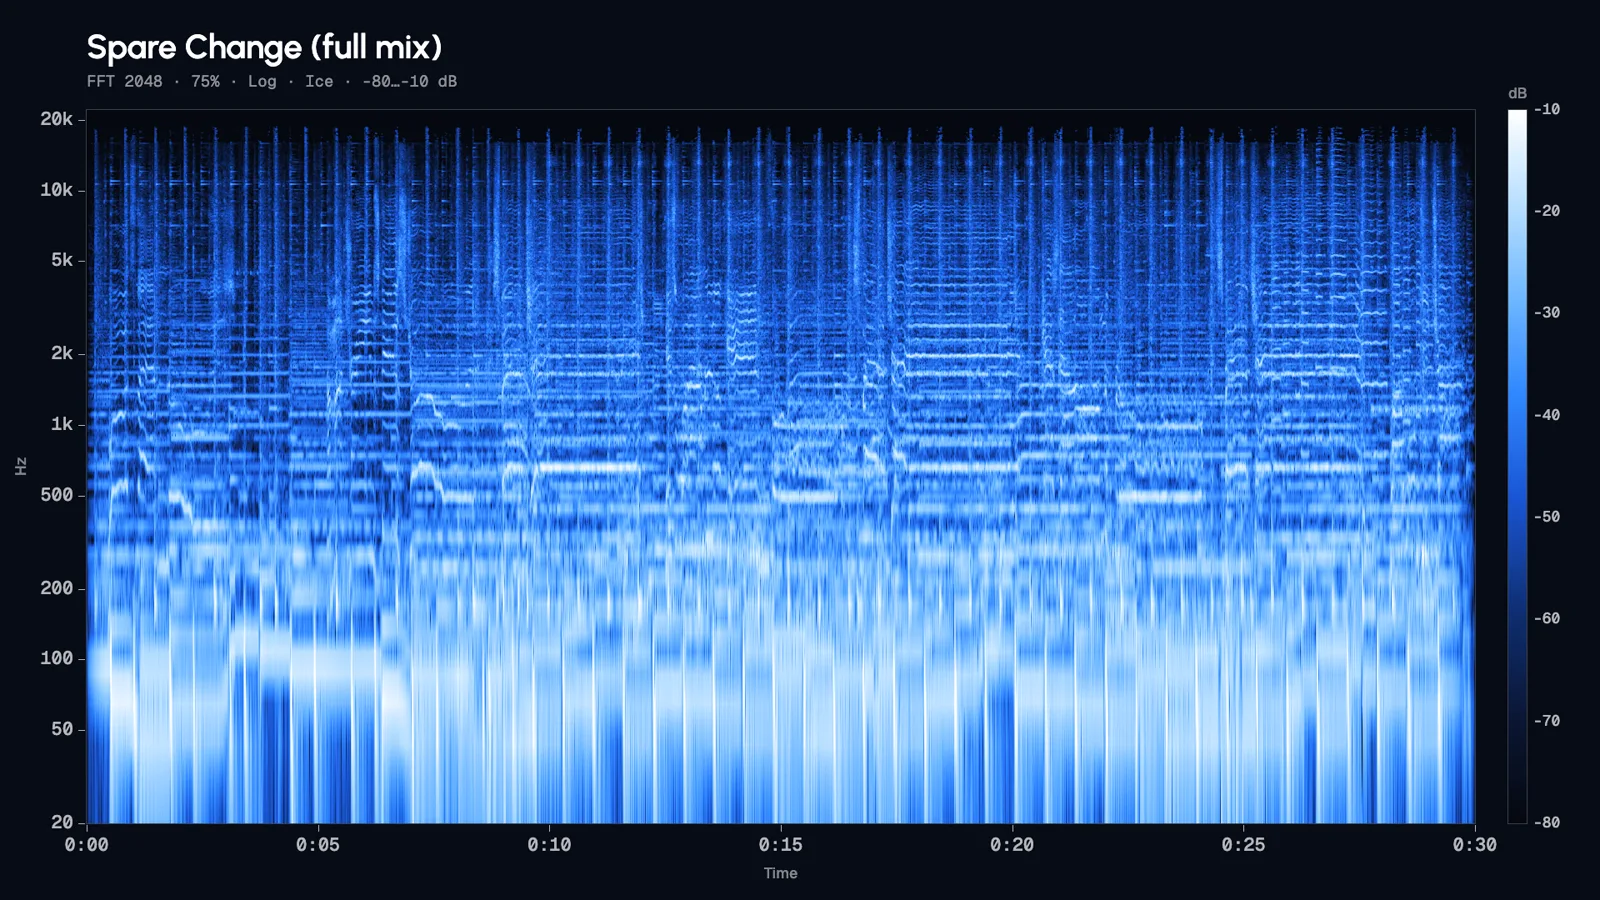
Full mix on a log scale
Kick and bass glow along the bottom, the vocal melody draws bright wavy lines between 300 Hz and 1 kHz, and hi-hats leave thin vertical streaks up top. The flat ceiling near 16 kHz is the MP3 encoder's low-pass filter.
- Full mix
- FFT 2048
- 75%
- Log
- Full
- Ice
- -80…-10 dB
- 1920×1080
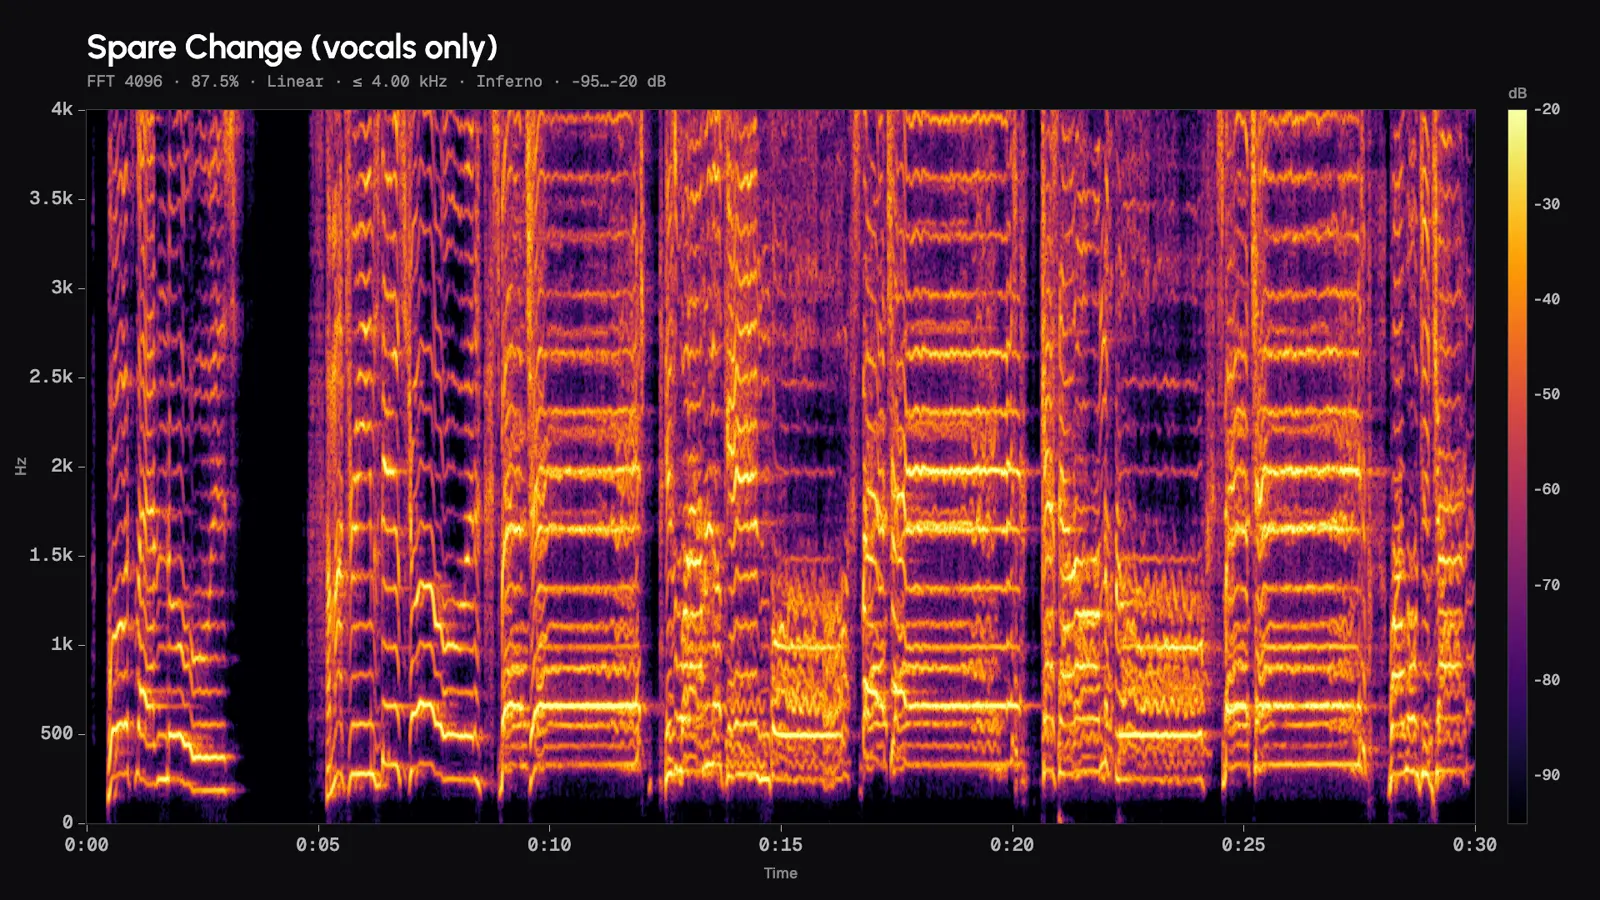
Vocals: a ladder of harmonics
On a linear axis up to 4 kHz, every sung note becomes a stack of evenly spaced lines, the fundamental at the bottom and its harmonics above. FFT 4096 keeps the rungs sharp enough to see vibrato wobble.
- Vocals
- FFT 4096
- 87.5%
- Linear
- ≤ 4 kHz
- Inferno
- -95…-20 dB
- 1920×1080
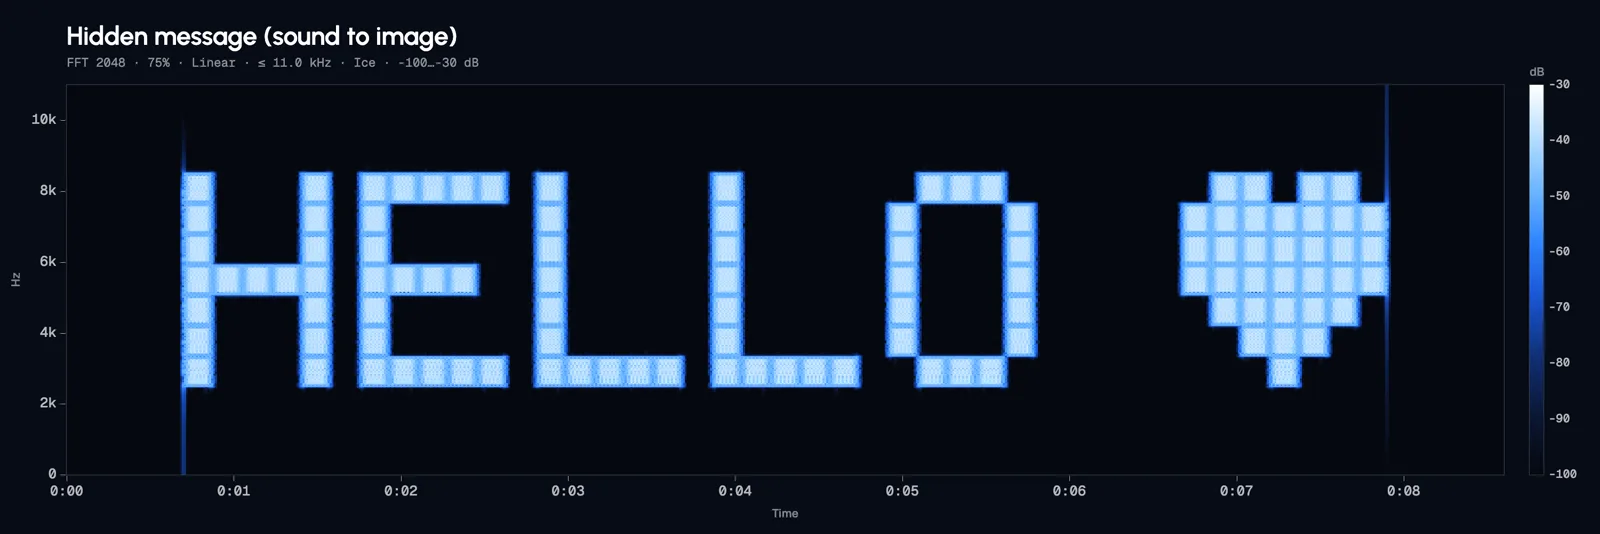
A hidden message: sound to image
This clip sounds like a chirpy hiss, but every pixel of each letter is a sine tone switched on at the right moment. On a linear axis up to 11 kHz it spells HELLO and a heart, the same trick artists use to hide faces and words in their tracks.
- Hidden message
- FFT 2048
- 75%
- Linear
- ≤ 11 kHz
- Ice
- -100…-30 dB
- 3000×1000
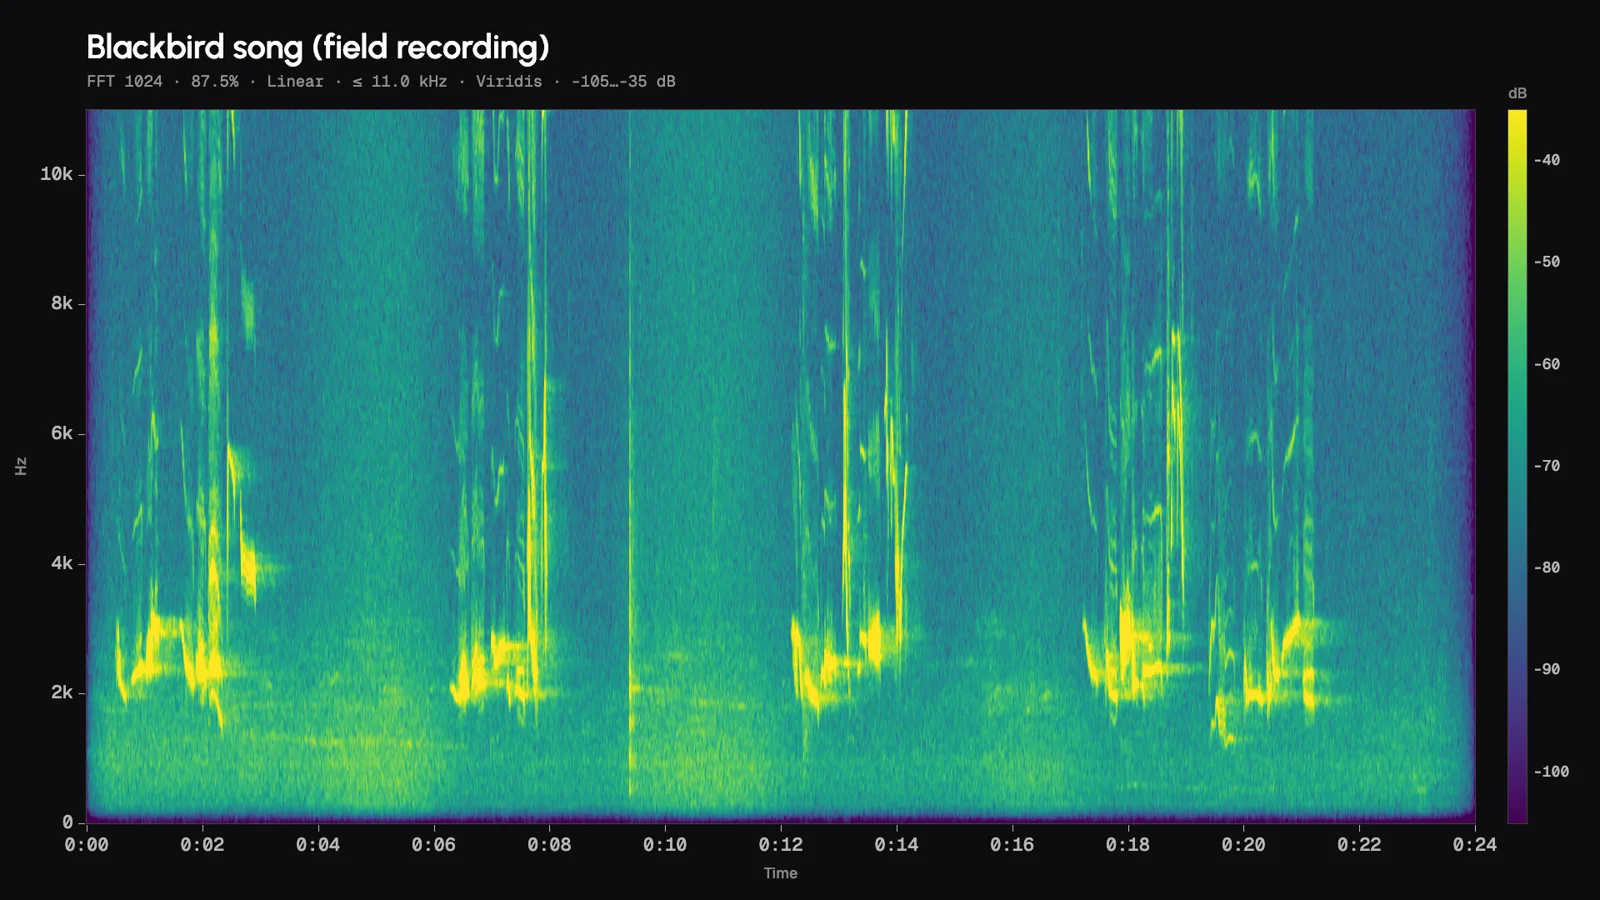
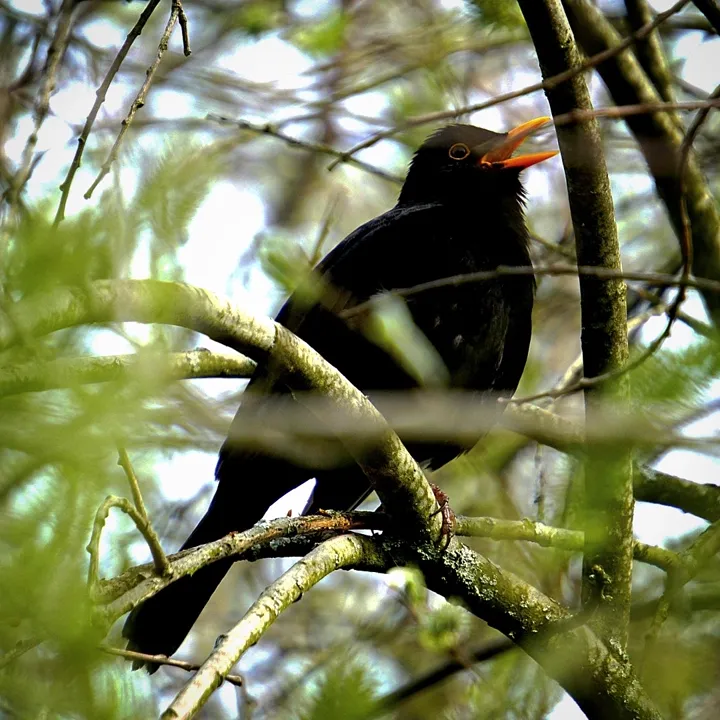
Blackbird song, recorded outdoors
Each phrase opens with low, fluting notes around 2 kHz and ends in fast twitters that climb past 8 kHz. A short FFT of 1024 keeps those quick strokes from smearing; the haze underneath is wind and distant traffic.
Recording: Marie-Lan Taÿ Pamart (xeno-canto XC552186), CC BY-SA 4.0, trimmed. Photo: Sara Lindgren von Bothmer, CC BY-SA 4.0.
- Blackbird
- FFT 1024
- 87.5%
- Linear
- ≤ 11 kHz
- Viridis
- -105…-35 dB
- 1920×1080
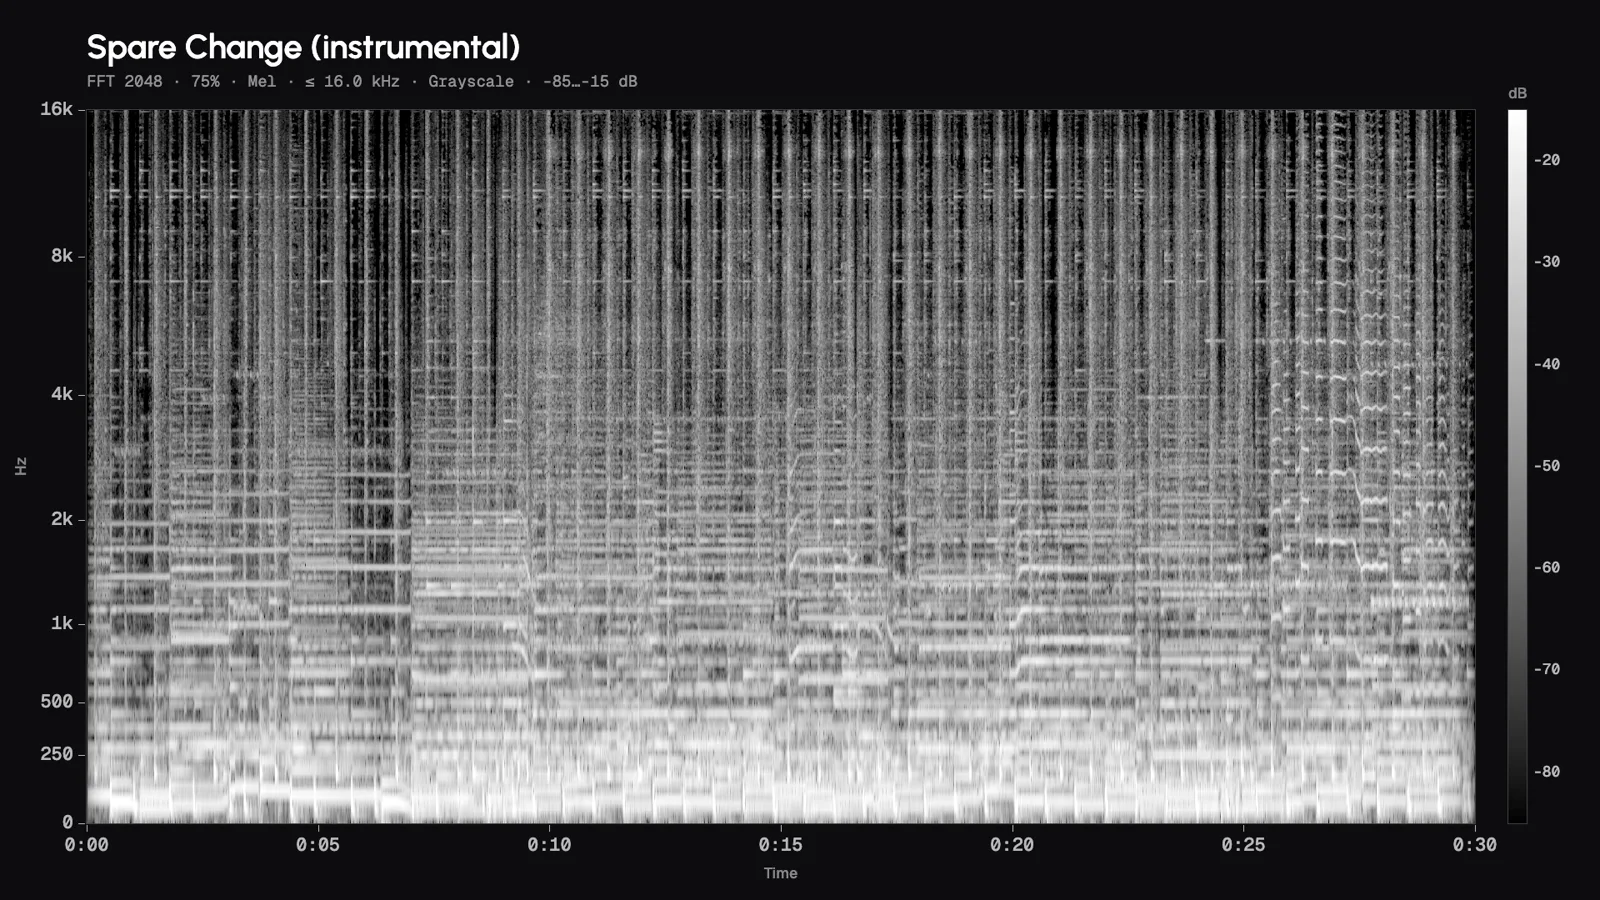
Instrumental in grayscale, mel scale
Mel spacing gives the guitar and piano range more room than a linear axis while keeping cymbals in view. Grayscale prints cleanly on paper and in black-and-white reports.
- Instrumental
- FFT 2048
- 75%
- Mel
- ≤ 16 kHz
- Grayscale
- -85…-15 dB
- 1920×1080
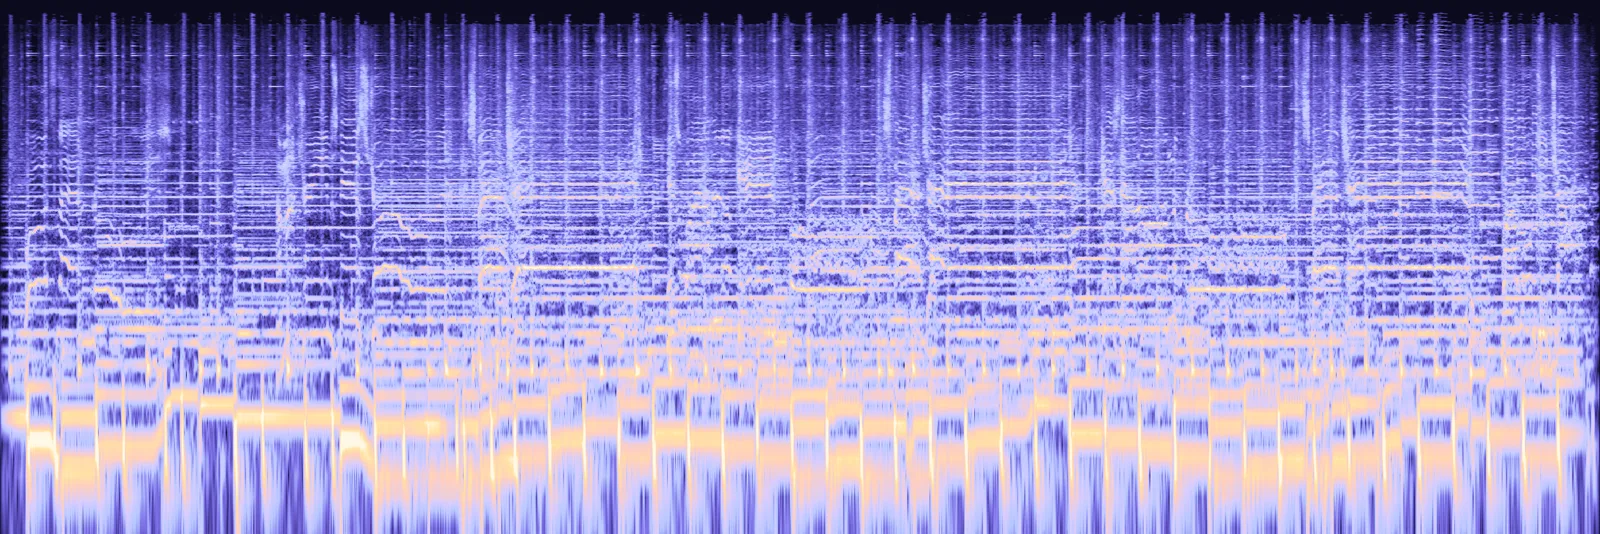
Banner artwork with the axes off
Turn off axes and a 3000 × 1000 export (Pro) becomes artwork: the whole chorus in our lilac palette, which runs from indigo through periwinkle to a pale warm tip, ready for a poster, a cover or a desktop wallpaper.
- Full mix
- FFT 4096
- 87.5%
- Log
- Full
- Lilac
- -85…-15 dB
- 3000×1000
- no axes
Want the picture to move? The audio visualizer turns a song into an animated video, and the waveform image generator draws clean artwork from the waveform itself.
How it works
How to make a spectrogram online in three steps
Pick a sound
Try a demo clip, drop in an MP3, WAV, M4A, OGG or FLAC up to 50 MB (500 MB with Pro), or switch to the live microphone to watch a spectrogram online as you speak.
Tune the view
Choose the FFT size, a linear, log or mel scale, a colour map and the dB range. The picture redraws instantly.
Read it, save it
Hover for time, frequency, note and level, zoom into any moment, then download a PNG with or without axes.
Settings explained
Spectrogram generator settings, explained
Five controls decide what you see in an online spectrogram. Here is what each one trades off, with numbers for a 44.1 kHz file.
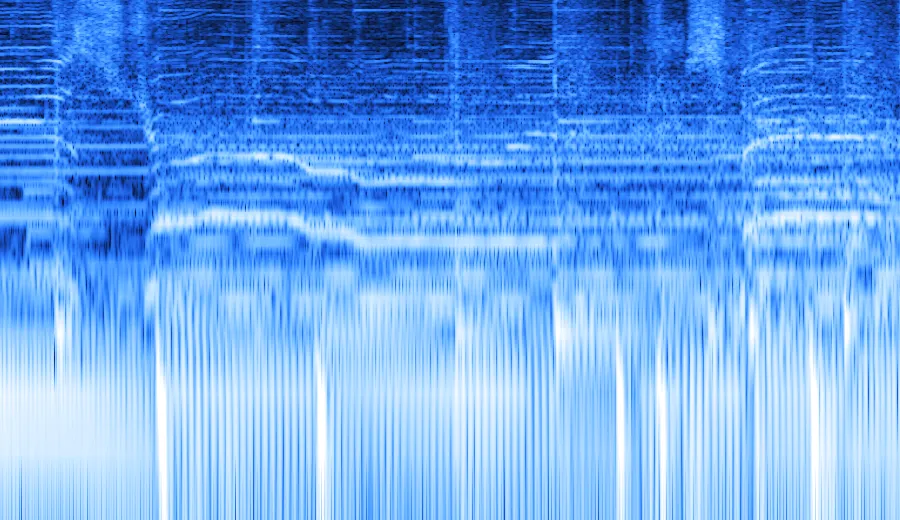
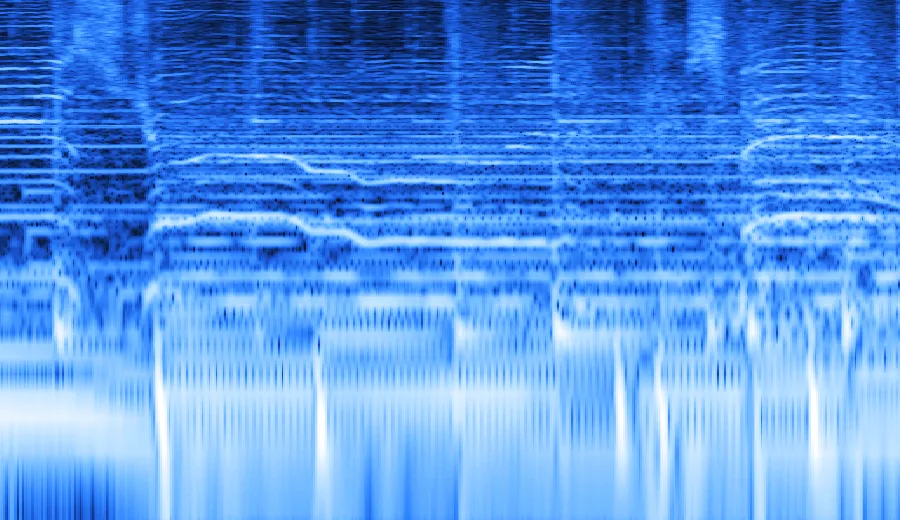
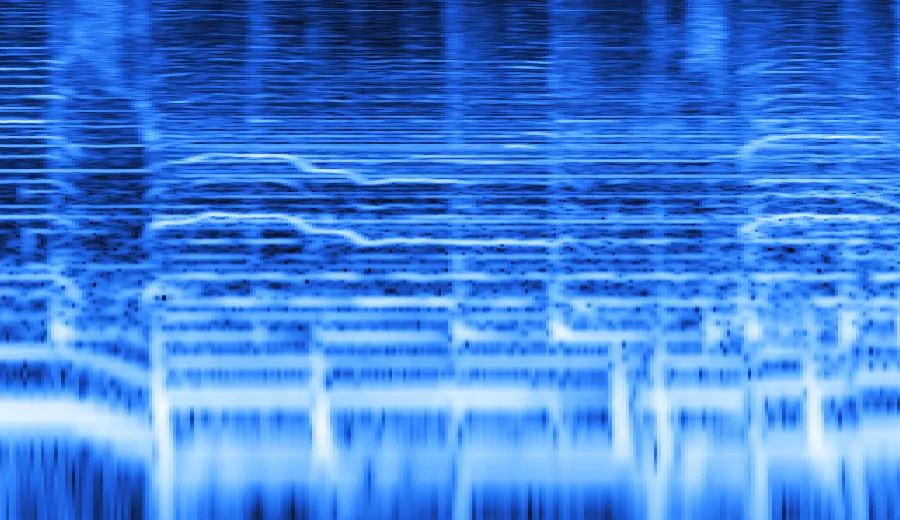
| FFT size | Window | Frequency step | Best for |
|---|---|---|---|
| 1024 | 23.2 ms | 43.1 Hz | Drums, speech and fast bird calls: sharp in time, blurry in pitch. |
| 2048 | 46.4 ms | 21.5 Hz | Most music. The default, a balance of both. |
| 4096 | 92.9 ms | 10.8 Hz | Bass notes, tuning and harmonics: sharp in pitch, smeared in time. |
Look at the bottom of each picture: at 1024 the bass is one wide smear but every drum hit is a crisp line; at 4096 the bass splits into separate notes while the hits blur. Overlap sets how far each window steps forward: at 75% a 2048 window moves 512 samples (11.6 ms), 87.5% draws smoother pictures, 50% analyses fastest.
Frequency scale
The same song, three ways to stack the frequencies.
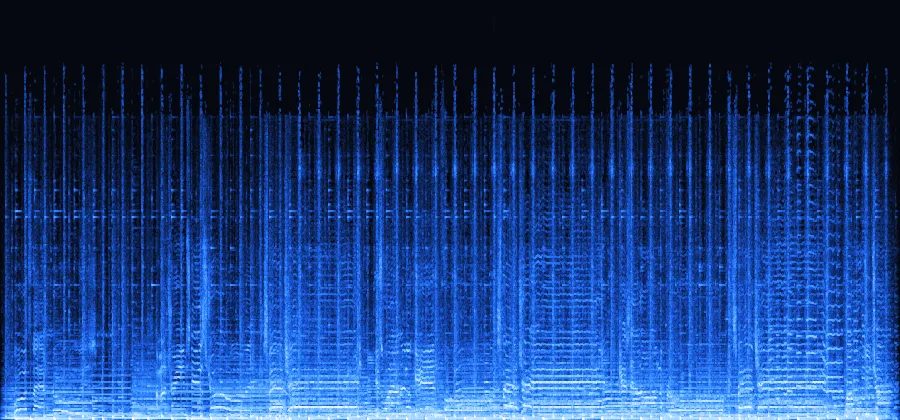
Linear gives every kHz the same height. Best for birdsong, speech and spotting an MP3 cut-off.
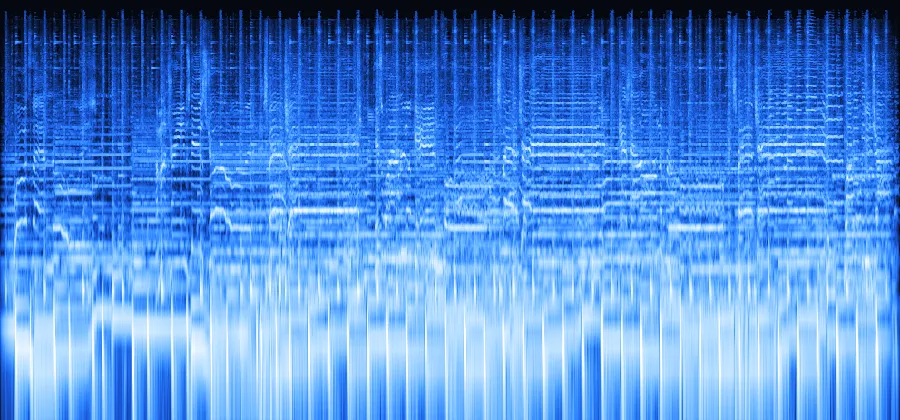
Log gives every octave the same height, like a piano keyboard. Best for music.
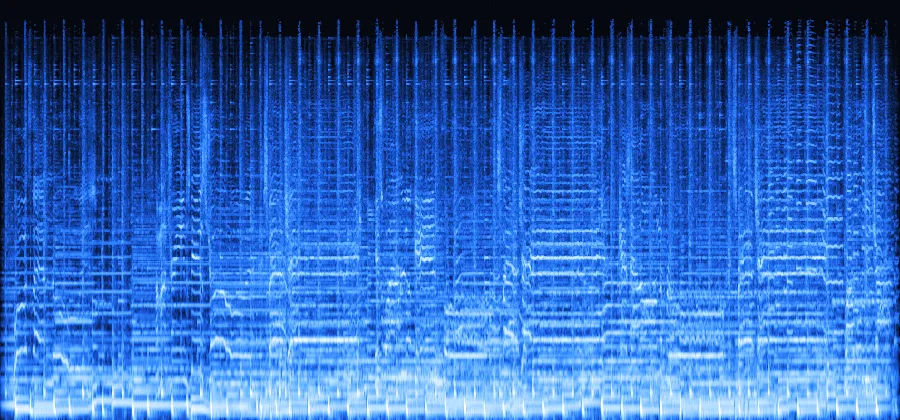
Mel follows how we hear pitch. It is the scale behind mel spectrograms in speech and AI work.
Colour map
Every map here gets brighter as the level rises, so loud always reads as bright. Magma, inferno and viridis are also perceptually uniform: equal steps in level look like equal steps in brightness, so quiet detail isn’t exaggerated.
- IceDefaultour default, tuned to the site blue
- Magmathe classic dark-to-bright default
- Infernomore punch in the loudest parts
- Viridisfriendly to colour-blind readers
- Lilaca cool pastel ramp for artwork
- Grayscalefor print and papers
dB range
Anything quieter than the floor turns black (noise, reverb tails); anything louder than the ceiling is full brightness. The tool fits both to each file: the ceiling sits just above the loudest moments and the window spans 70 dB. Raise the floor to clean up a noisy recording, lower it to reveal faint detail.
Use cases
What people use an online spectrogram for
A waveform shows how loud a sound is. An audio spectrogram shows what it is made of, which is why it turns up in birding, studios, voice work and art.
 2–8 kHz

Birding and field recordings
- Linear
- ≤ 11 kHz
- FFT 1024
Mixing and mastering checks
- 50 / 60 Hz
- 2–5 kHz
- 16 kHz
Voice, singing and speech

Whales and wildlife
Teaching sound and physics
hello.mp3 · 0:08Sound-to-image art
- 3000×1000
- no axes
- PNG
Photos via Wikimedia Commons: blackbird by Thorsten Denhard (CC BY-SA 3.0), gold microphone by Karen (CC BY 2.0). Other photos from Unsplash.
Guide
How to read a sound spectrogram
Time runs left to right, pitch rises from bottom to top, and brightness shows how loud each frequency is. These five patterns explain most of what you'll see in eight seconds of our demo song.
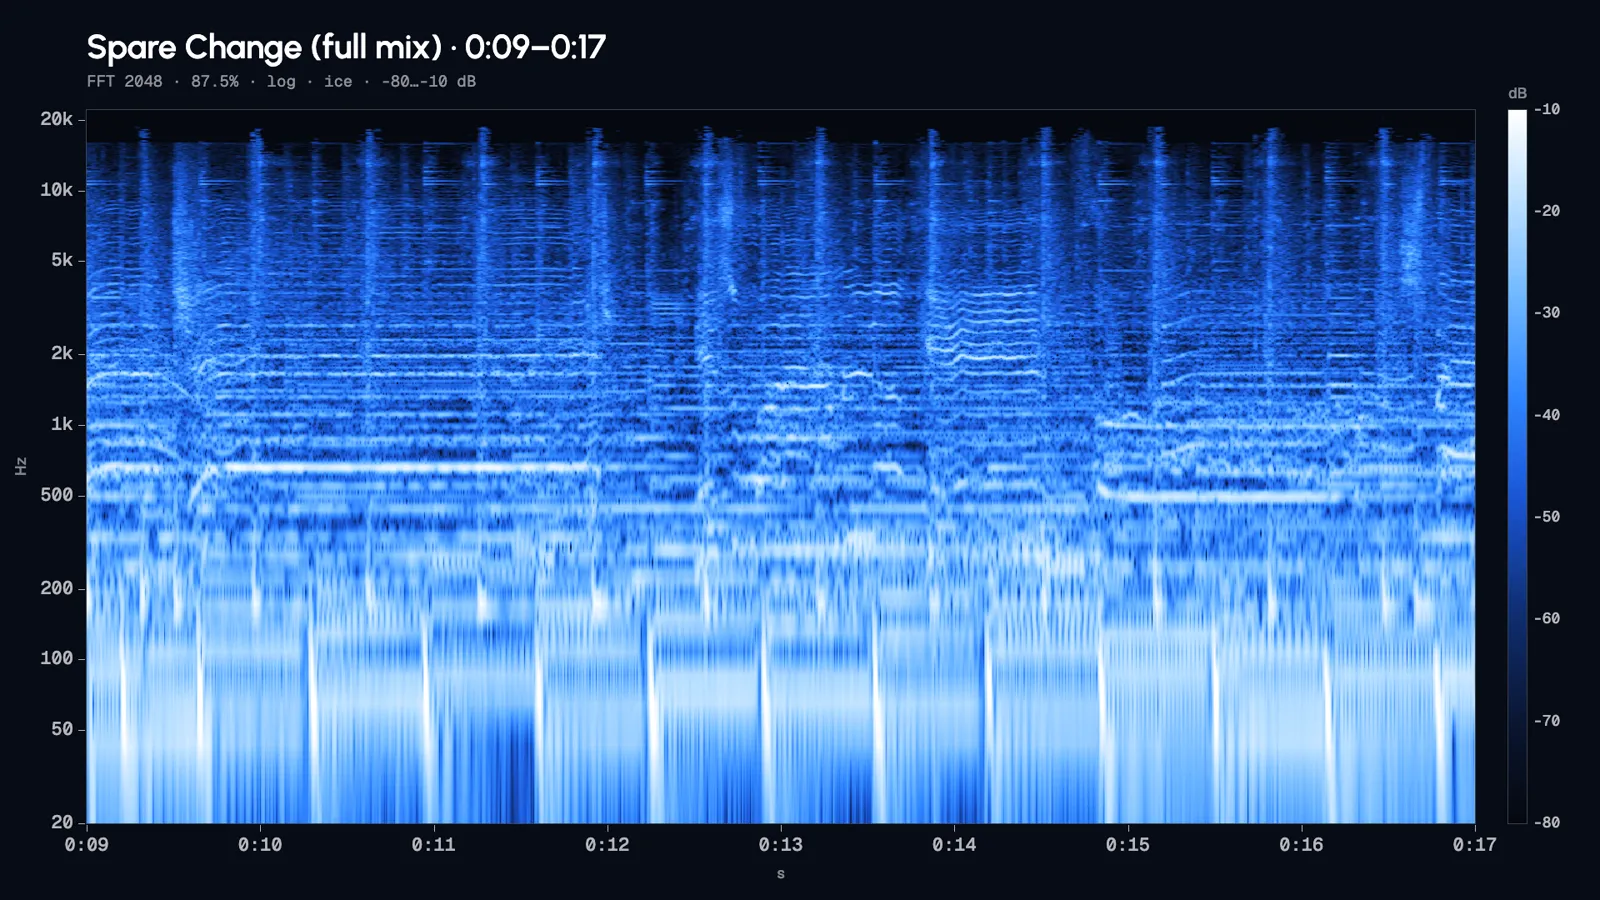
- 1A held noteA long horizontal line is one steady pitch, here the singer holding a note around 650 Hz.
- 2Its harmonicsFainter copies stacked above it at 2×, 3×, 4× the frequency. Their pattern is what makes a voice sound different from a flute.
- 3VibratoWavy lines mean the pitch is wobbling. The wobble looks bigger on higher harmonics.
- 4Drum hitsShort vertical streaks cover many frequencies at once. Kicks sit low, hi-hats and snares reach the top.
- 5The MP3 ceilingThe dark band above about 16 kHz is the encoder's low-pass. Lossless recordings usually carry on to 20 kHz.
Where common sounds live
Approximate ranges, fundamentals and main energy
Mains hum50–60 Hz
Kick & bass40–200 Hz
Male voice pitch85–180 Hz
Female voice pitch165–255 Hz
Piano range27.5–4.2k Hz
Songbirds1k–8k Hz
Sibilance (s, sh)5k–10k Hz
Cymbals & air8k–16k Hz
FAQ
Spectrogram questions, answered
A spectrogram is a picture of sound: time on the horizontal axis, frequency on the vertical axis and loudness as colour. It is made by cutting the audio into short overlapping windows and running a Fourier transform (FFT) on each one, so you can see which pitches are present at every moment. You can make a spectrogram online with the tool at the top of this page.
Open the tool at the top of this page, pick a demo clip or drop in your own MP3, WAV, M4A, OGG or FLAC file (up to 50 MB free), and the audio spectrogram appears within seconds. There is no signup or watermark, and the file is analysed in your browser instead of being uploaded. Free covers 10 minutes of audio and 10 PNG downloads a day; Pro takes files up to 500 MB and 2 hours.
2048 is a good all-rounder for music. Use 1024 when timing matters (drums, speech, fast bird calls) and 4096 when you need fine pitch detail, such as bass notes or checking tuning. A bigger window sharpens frequency but blurs time.
A mel spectrogram spaces frequencies on the mel scale, which follows how people hear pitch: close to linear below about 1 kHz and logarithmic above. It is the standard input for speech recognition and audio machine-learning models. Choose Mel under Frequency scale to view one.
Yes. Switch to Live microphone, allow access, and the spectrogram scrolls in real time over a 5, 10 or 20-second window, a quick way to see your voice or an instrument as a spectrogram online. Freeze it to inspect a moment or save a snapshot as a PNG. Nothing is recorded or sent anywhere.
No install is needed. Audacity's spectrogram view is great when you are editing, but this spectrogram online works in any modern browser on desktop or phone, and adds hover readouts, a live microphone mode and image export at 1920 × 1080 free, or up to 3840 × 2160 with Pro.
Turn your next sound into a picture
Drop in a song, a voice memo or a bird you recorded on your walk and see what it is made of. The spectrogram online is free, with no signup.
Free · no signup · no watermark · processed in your browser