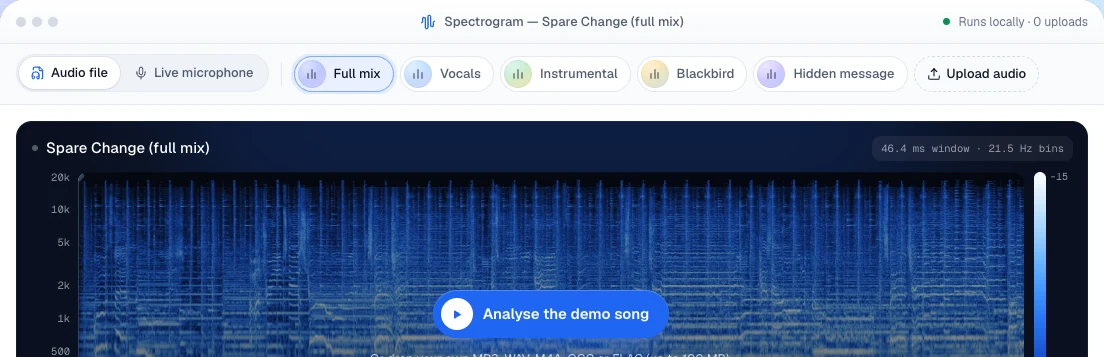
What is a spectrogram?
A spectrogram is a picture of sound. The audio is cut into short overlapping slices; each slice is split into its frequencies with a Fourier transform (FFT); then the slices are lined up side by side. Each column is one moment, each row one frequency, and the colour of each pixel is how loud that frequency was at that moment.
A waveform tells you when something is loud. A spectrogram also tells you what is loud: a bass note, a hi-hat, a hum, a voice.
How to read a spectrogram in 3 steps
- 1
Read the x-axis: time
Time runs left to right, like a timeline in a video editor. Anything that starts suddenly appears as a sharp left edge.
- 2
Read the y-axis: frequency
Low sounds sit at the bottom, high sounds at the top. Check the scale: a linear axis gives every kHz the same height, while a log axis gives each octave the same height, which matches how we hear.
- 3
Read the colour: loudness
Brighter means louder. The colour bar maps colour to decibels; the darkest areas are close to silence.
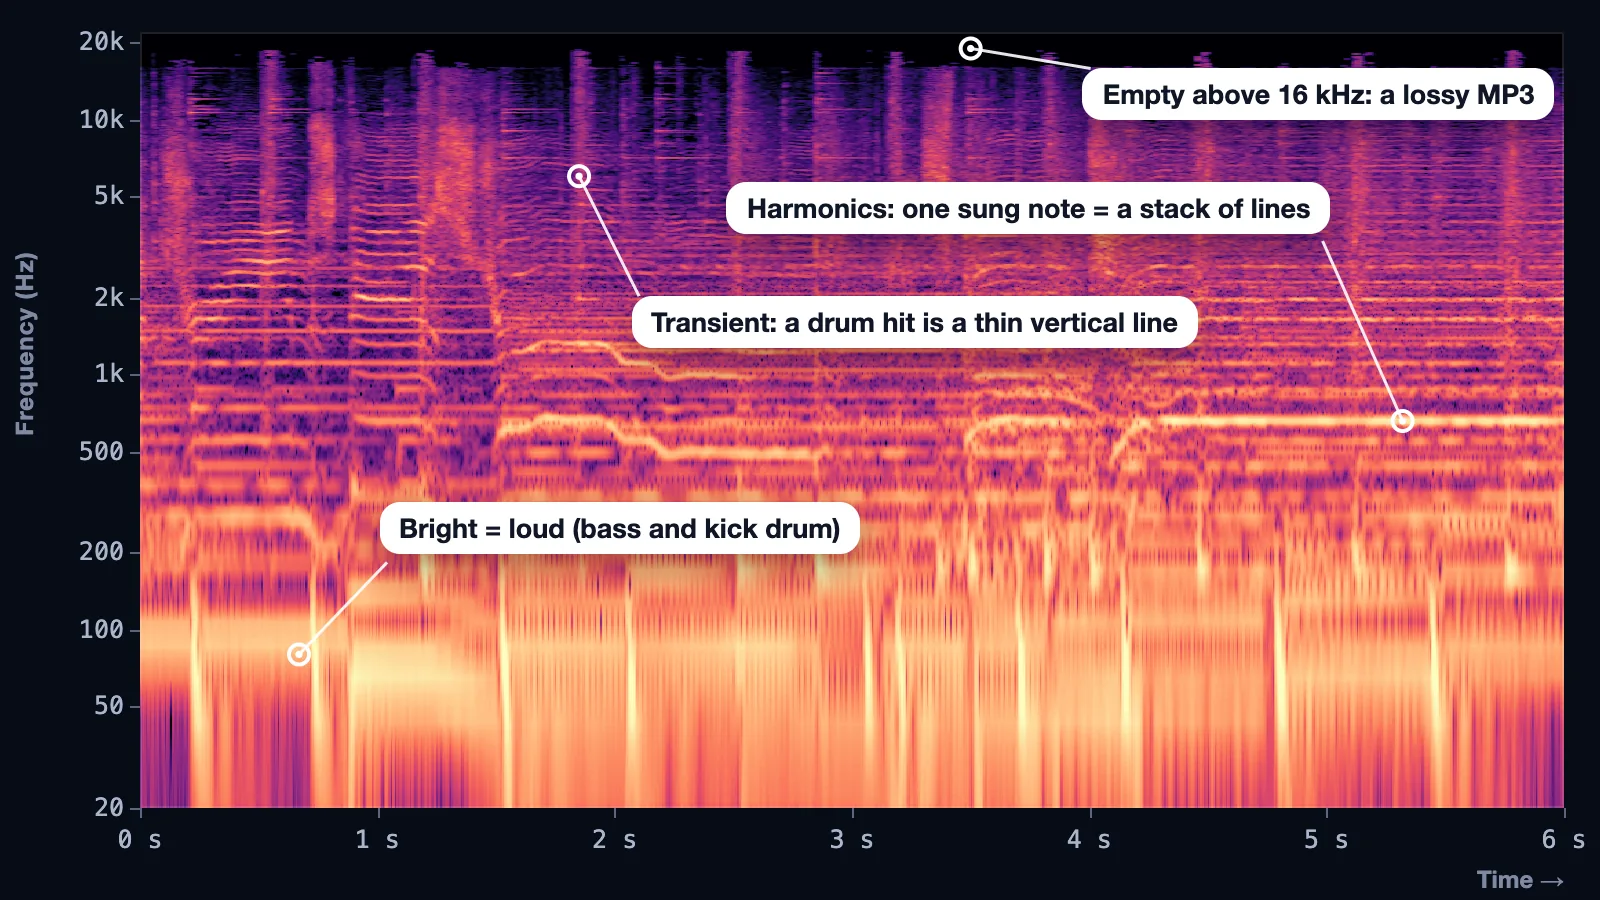
How to read spectrogram patterns
Once the axes make sense, reading a spectrogram means recognising shapes. These seven cover most of what you'll see:
| What you see | What it means | Typical source |
|---|---|---|
| One horizontal line | A steady, pure tone | Mains hum (50 or 60 Hz), a test tone, a whistle |
| A stack of evenly spaced lines | One pitched sound: the lowest line is the fundamental, the rest are harmonics | Sung vowels, guitar, piano, violin |
| A thin vertical line | A transient: energy at many frequencies at once, for an instant | Drum hits, clicks, the "t" and "k" in speech |
| A fuzzy cloud | Noise spread over a band | Hiss, rain, cymbals, "s" and "sh" sounds |
| Lines that bend or wobble | Pitch changing over time | Vibrato, slides, birdsong, sirens |
| A flat ceiling, nothing above | Frequencies removed by a filter or encoder | MP3 and AAC files, old recordings |
| A dark gap across the whole height | Silence | Pauses, breaths, the end of a note |
Voice, music and birdsong compared
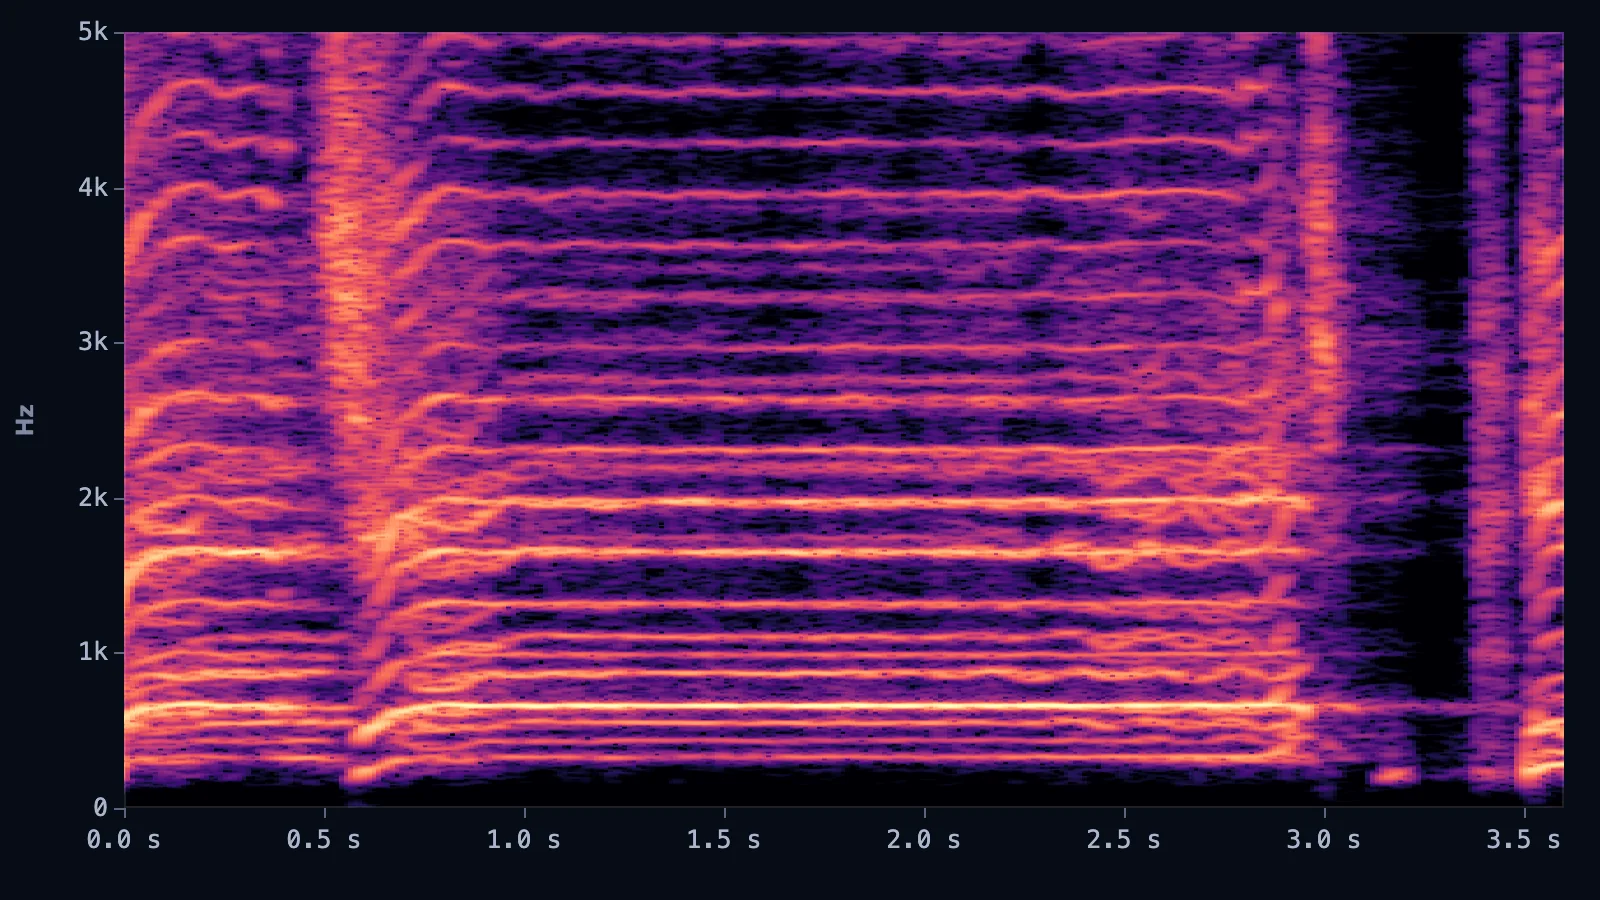
Voice
A held, sung note is the clearest example of harmonics. On a linear axis the lines are evenly spaced, one fundamental frequency apart. Vowels show up as bright stacks; consonants appear as short noisy bursts between them. The brighter bands inside a stack are formants, the resonances of the mouth and throat that make an "ah" sound different from an "ee".

Music
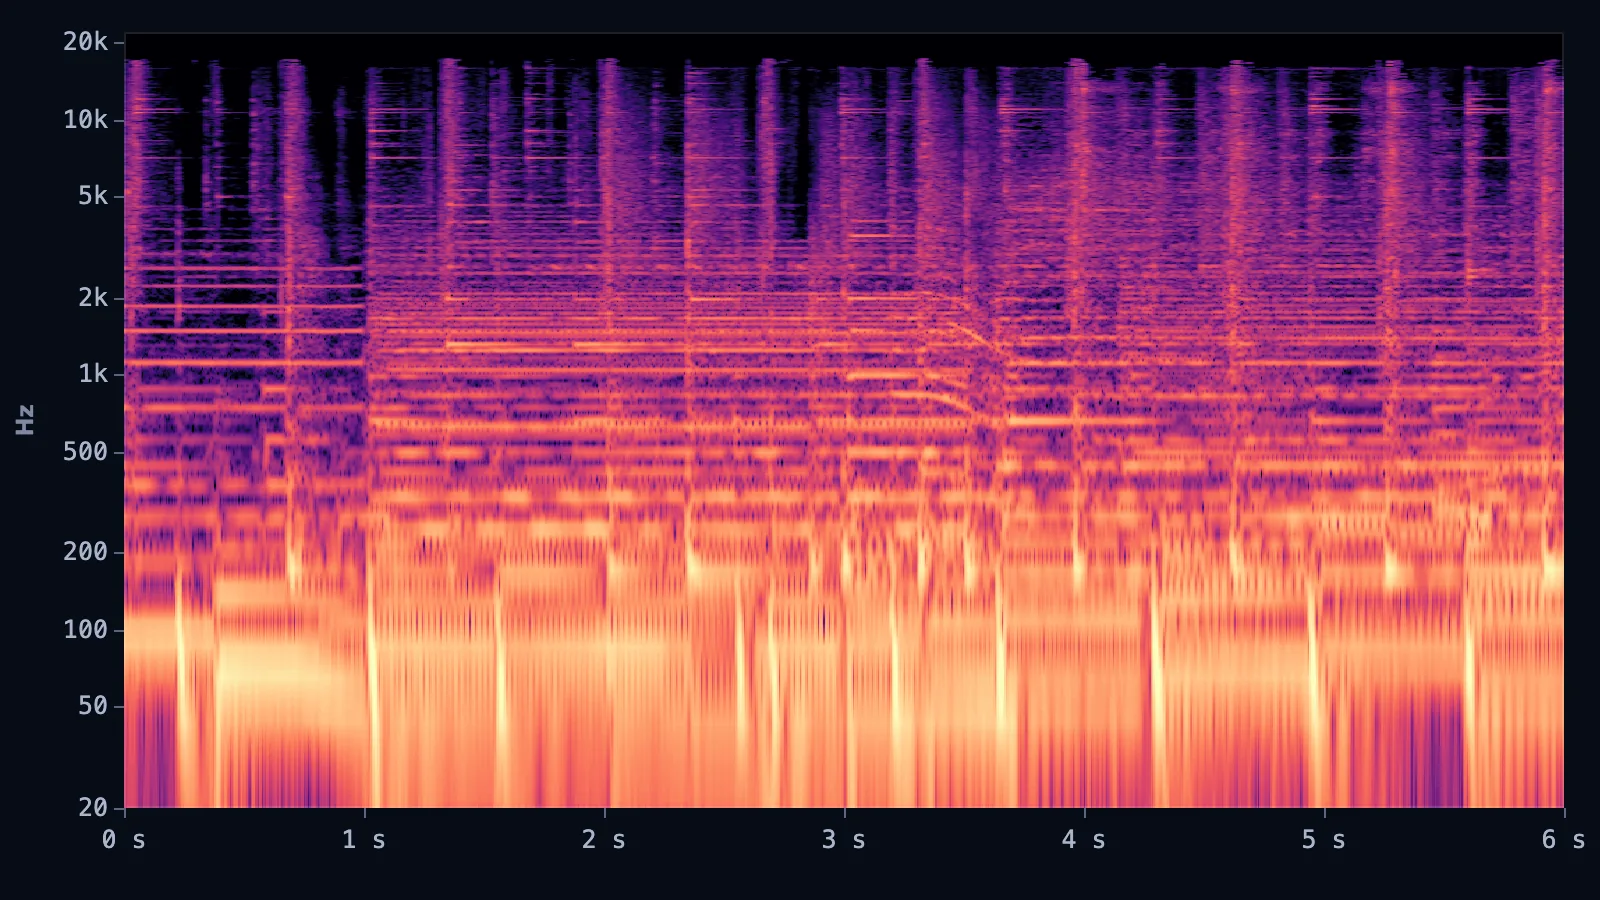
A full band stacks everything at once. Kick and bass fill the bottom with bright, broad energy. Every drum hit draws a vertical line, so you can count the beat by eye. Chords add several harmonic stacks on top of each other, and cymbals fill the top with noise.
Birdsong
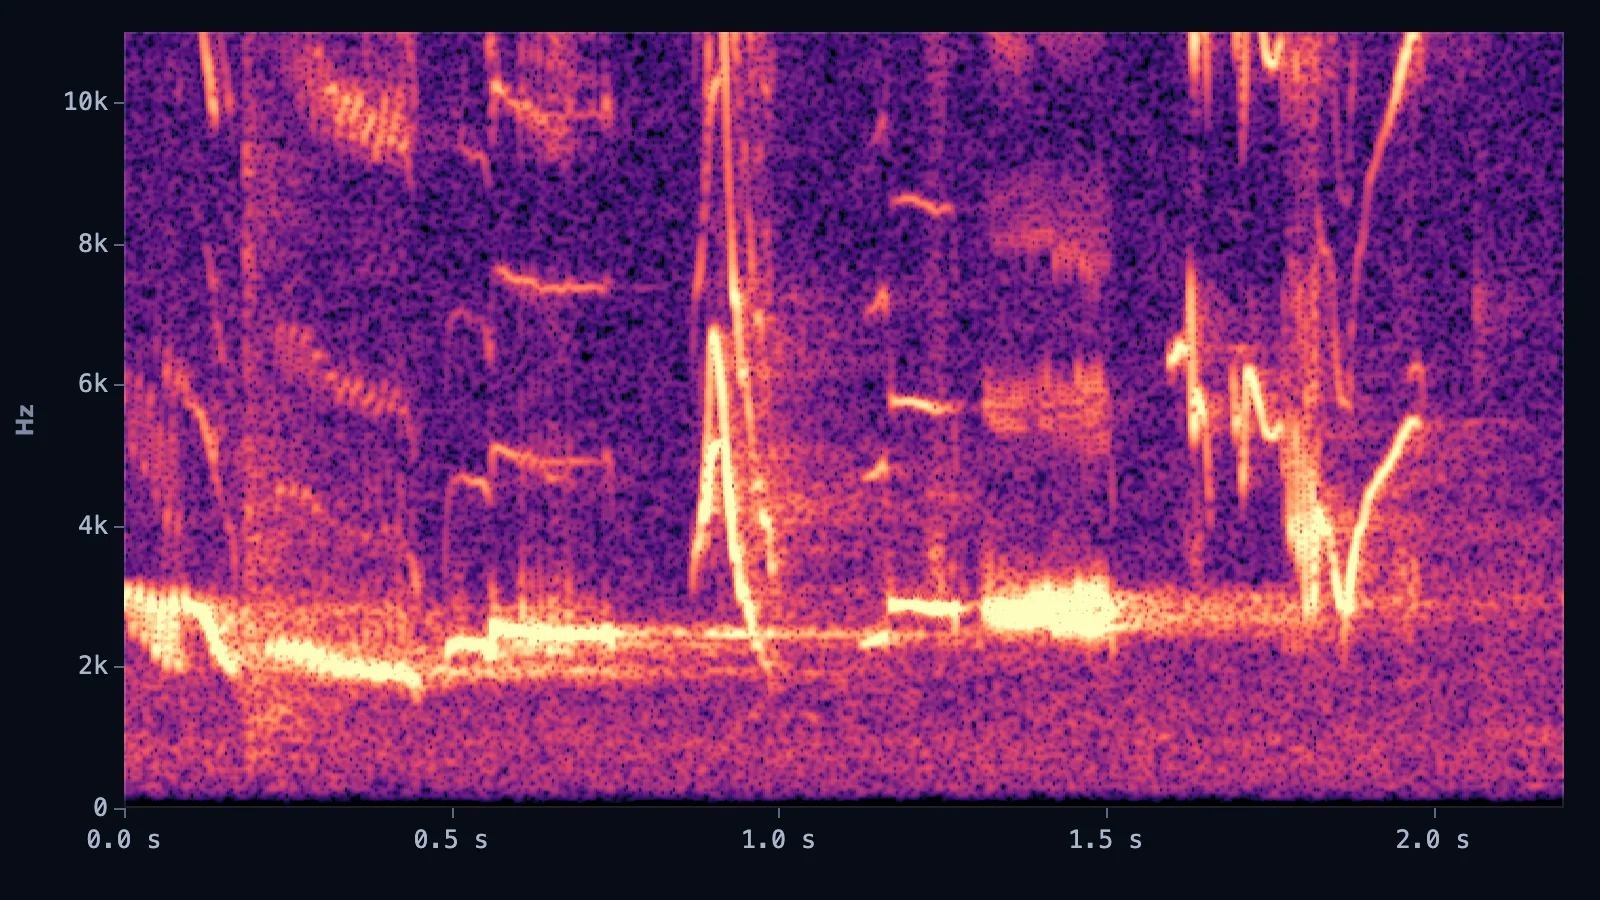
Birds sing fast and high, usually between 2 and 8 kHz, with notes that sweep up and down in a few hundredths of a second. To our ears it's a blur; in a spectrogram each note becomes a clear shape. Birders use those shapes to tell similar species apart. The background haze at the bottom is wind and distant traffic.
FFT size: the time vs frequency trade-off
The FFT size is how many samples go into each slice, and it decides what you can see. A long slice measures frequency precisely but blurs timing. A short slice catches timing but blurs frequency. You can't have both in one picture.
| FFT size | Window at 44.1 kHz | Frequency resolution | Best for |
|---|---|---|---|
| 1024 | 23 ms | 43 Hz | Drums, consonants, fast chirps |
| 2048 | 46 ms | 21.5 Hz | Most music; a good default |
| 4096 | 93 ms | 10.8 Hz | Harmonics, bass notes, tuning |
Drag the handle to compare the same three seconds of vocals at both extremes. At 1024 the note onsets are crisp but the harmonics smear into thick bands. At 4096 every harmonic is a thin line, but the starts of the notes get soft.
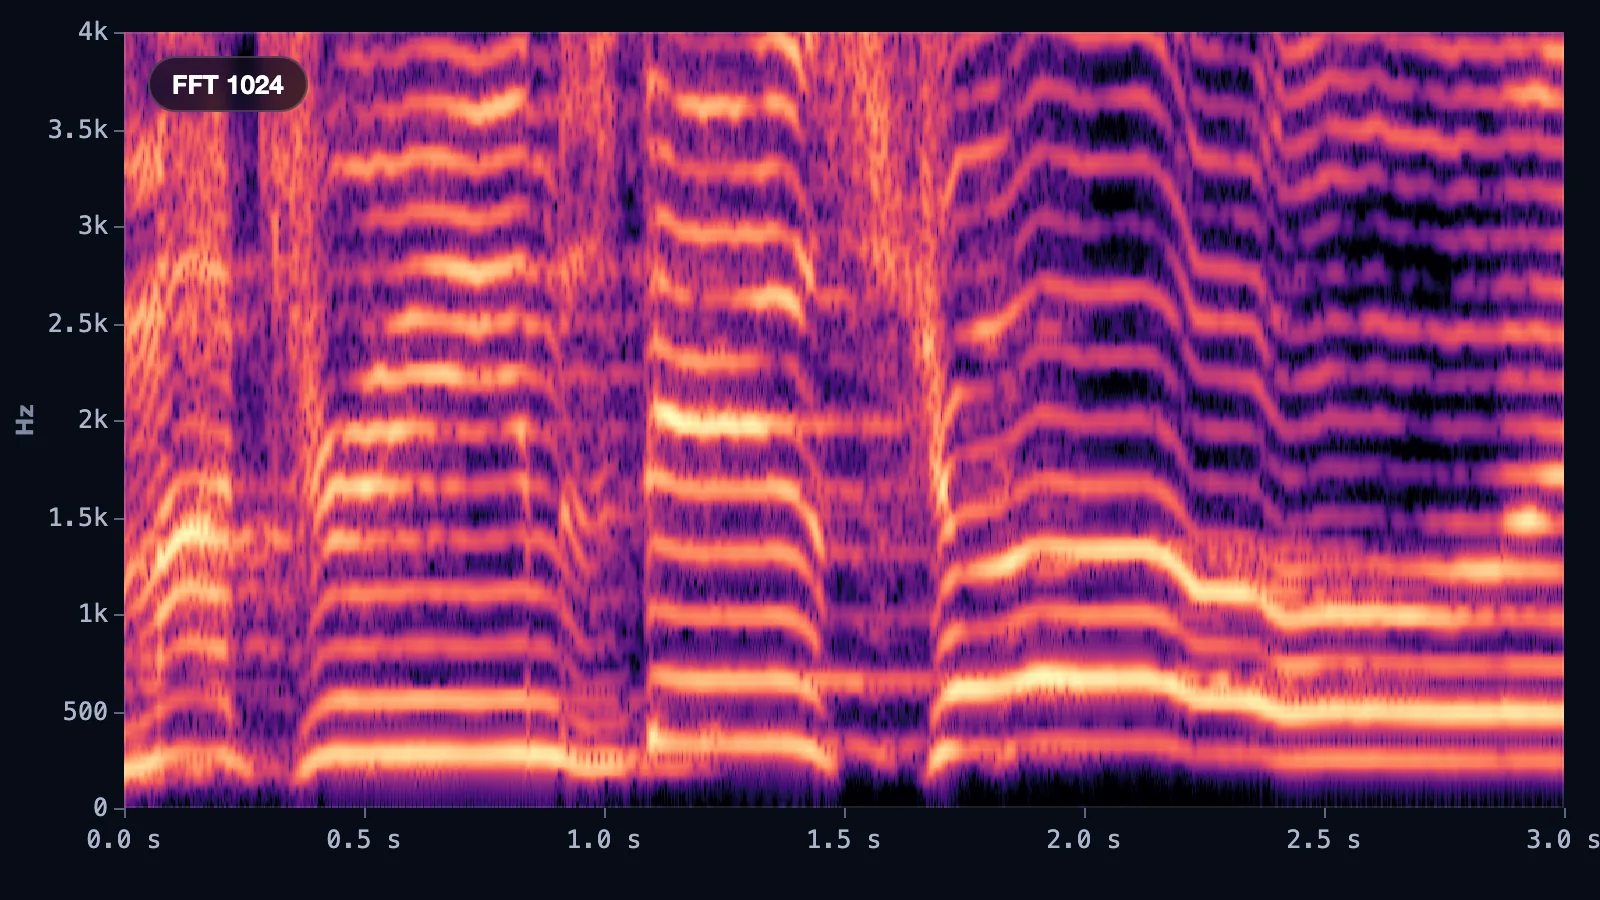
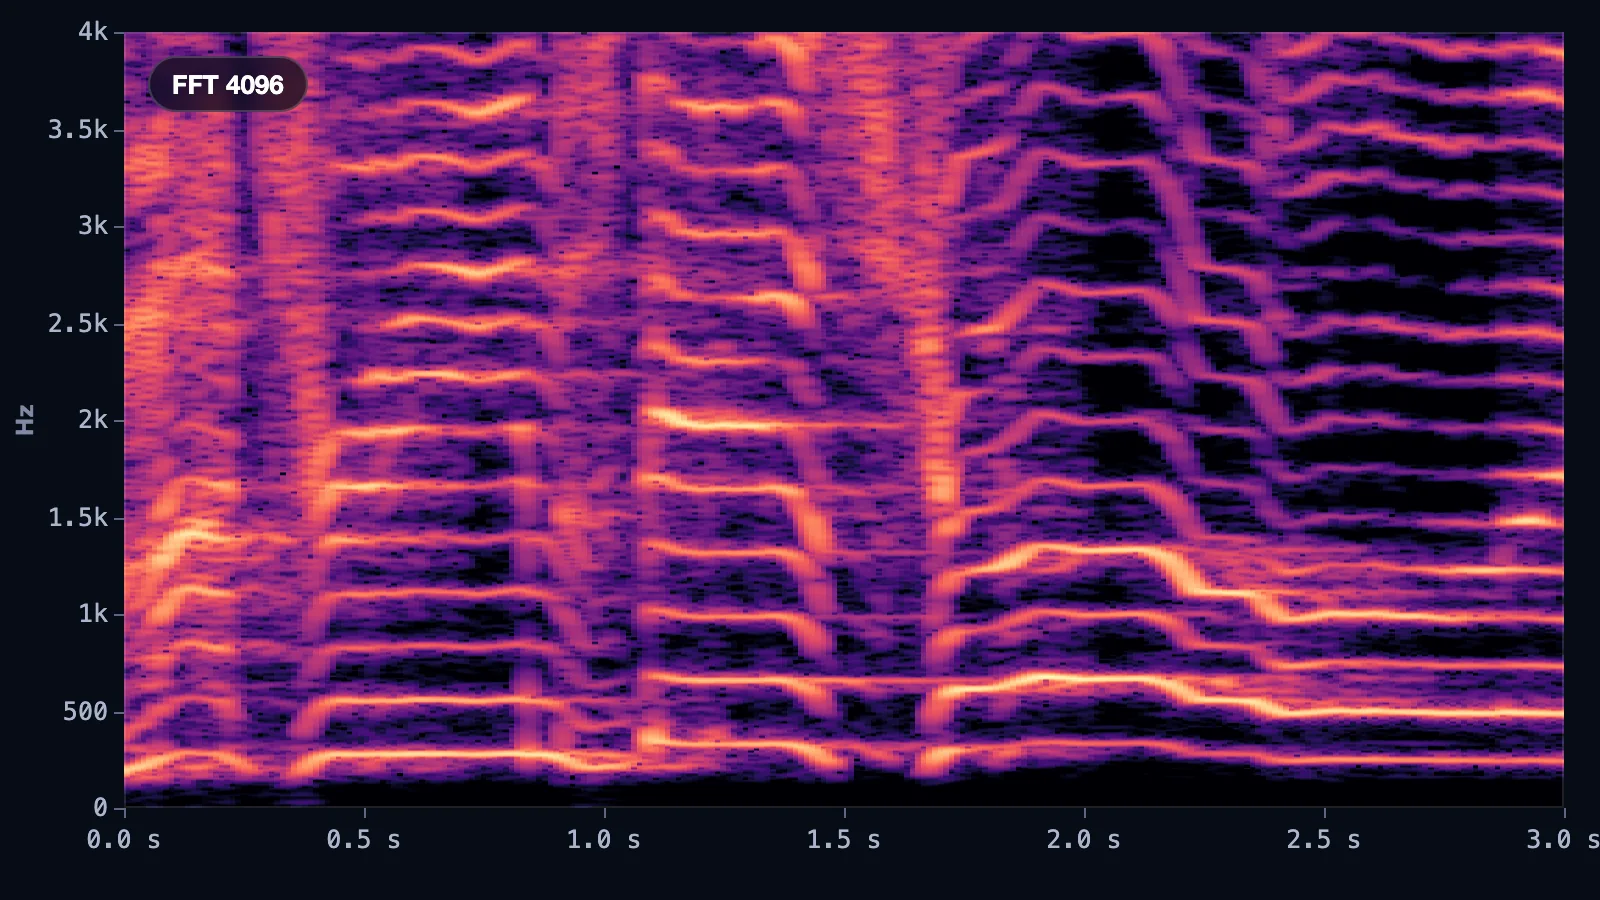
Same vocal, same colours. Only the FFT size changes.
Overlap fills the gaps
Overlap (50%, 75% or 87.5%) doesn't change the trade-off. It adds more slices between the existing ones, so a large FFT looks smoother over time.
Finding hidden images in a spectrogram
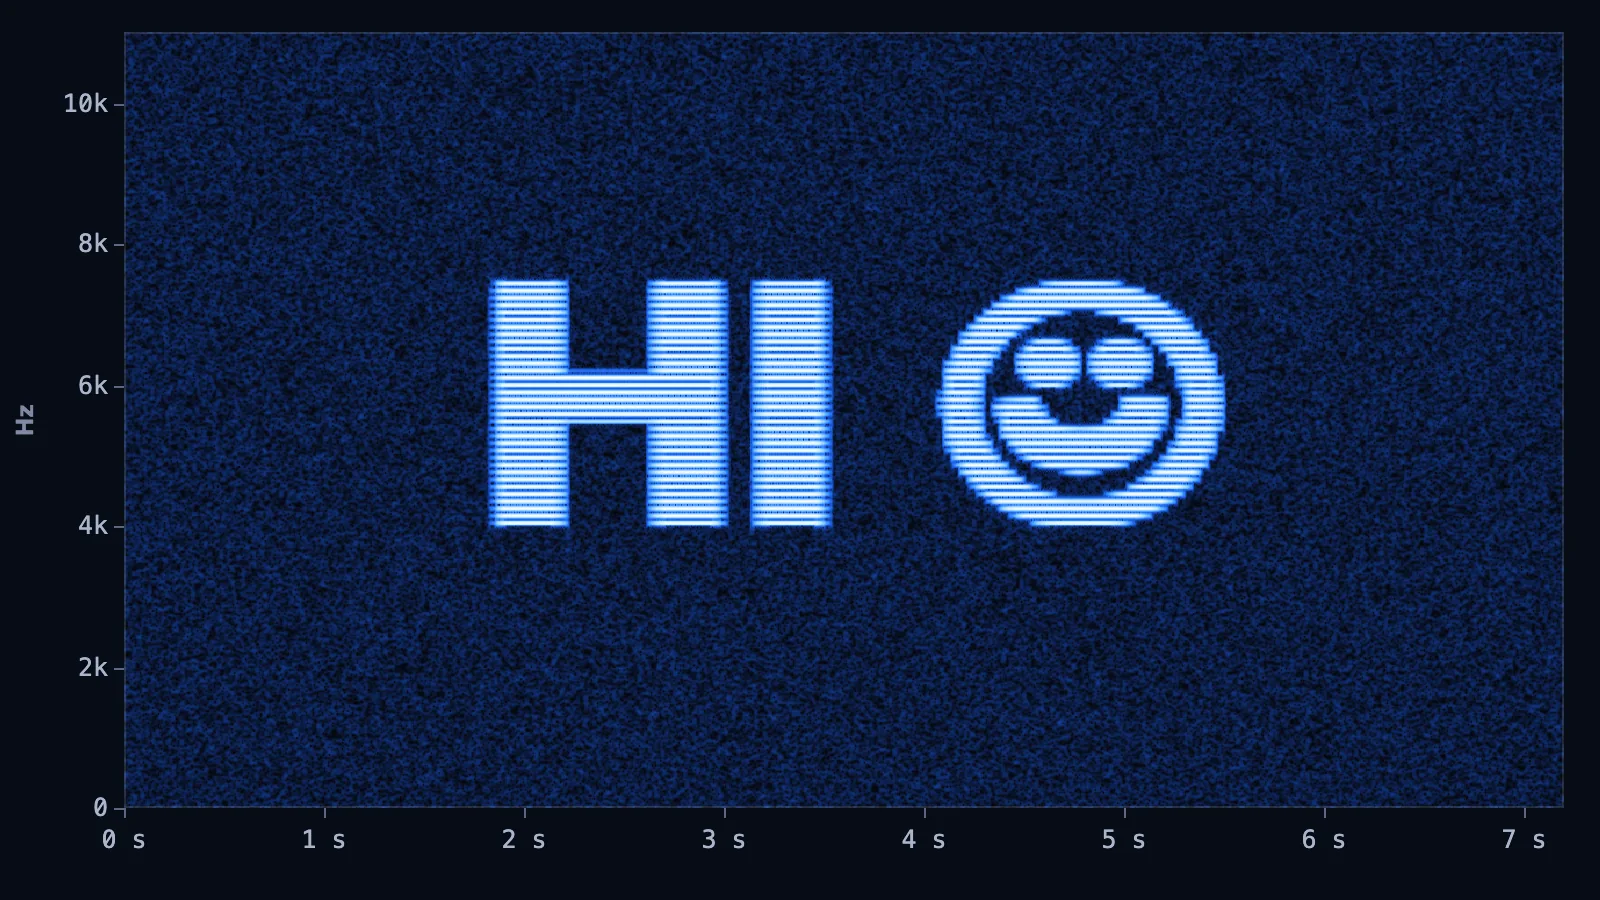
Because a spectrogram is a picture, you can also paint one. Each pixel row becomes a sine tone at one frequency, and its brightness sets the volume, so playing the sound "draws" the image. Musicians have hidden pictures this way for decades; Aphex Twin's 1999 Windowlicker single famously hides a face.
To find one, use a linear frequency axis, FFT 2048 or larger, and a narrow loudness range so faint tones stand out. Check the end of a track and the upper frequencies, where an image doesn't clash with the music. Below is a clip we made: it sounds like a buzzy, shifting chord, and it reads like a greeting.
Make a spectrogram of your own audio
The best way to learn is to look at sounds you know. Our Online Spectrogram Generator runs in your browser: pick a demo (full mix, vocals, instrumental, blackbird, hidden message) or drop in your own file, then hover anywhere to read the exact Hz, musical note and dB. Switch FFT size, scale and colour map in one click, and save a PNG up to 4K.