Spectrogram Decoder & Image to Sound
This spectrogram decoder shows the pictures people hide inside sound. Load a clip, zoom into the frequency band and raise the contrast until the image appears, then save it as a PNG. Switch to encode mode to turn your own picture or text into sound. Nothing is uploaded.
- Free, no signup
- Decode and encode
- PNG and WAV export
Secret message (typed text)
21.5 Hz rows

Or drop your own MP3, WAV, M4A, OGG or FLAC (up to 50 MB free, 500 MB with Pro). It is analysed in your browser and never uploaded.
256 × 480 · 2 kHz–12 kHz
Each row of this grid becomes one frequency, each column a moment in time. Brighter = louder.
Keep the WAV. MP3 at 128–192 kbps cuts most content above about 16 kHz, so a picture placed there disappears.
One sine wave per row: crisp edges, fine row lines, a whistling sound.
—
Built in
Two tools in one window
Read pictures out of audio, or write them in. Both directions run on your device, with the same frequency maths.
- 0 uploadsAudio and pictures stay in your browser
- 100 MBAudio files up to 50 MB free, 500 MB with Pro
- 20 Hz – 20 kHzEncode into any band you choose
- PNG · WAVDecoded PNG up to 1920 px wide free, 3000 px with Pro
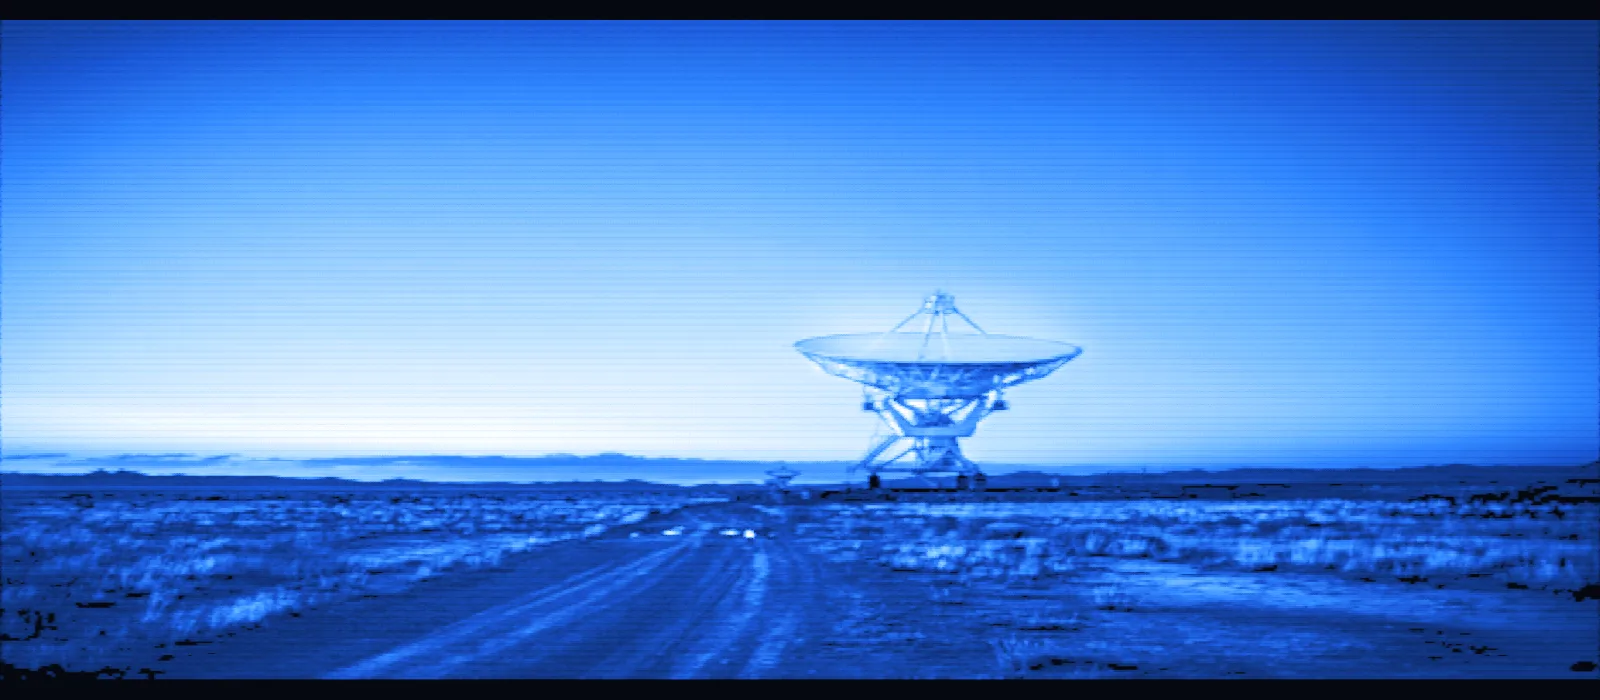
Decode: audio → picture
- FFT 1024–4096
- Linear
- Log
- Invert

Encode: image to sound
- 2–30 s
- 128–400 rows
- WAV 16-bit
Examples
Hidden images in audio, found with this decoder
Every picture below was encoded with the tool's image to sound mode and decoded again with the spectrogram decoder. Play the clip, then open it in the decoder with the same settings.
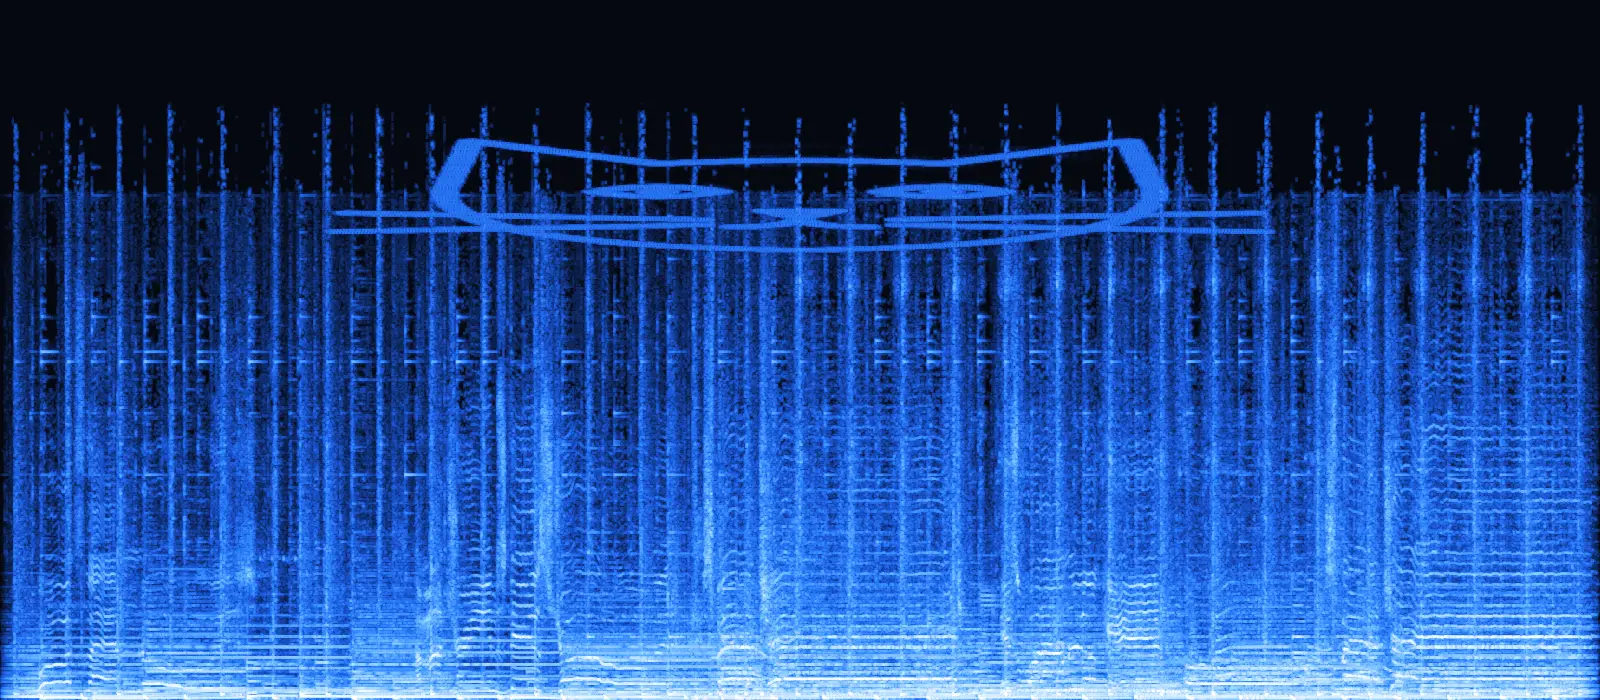
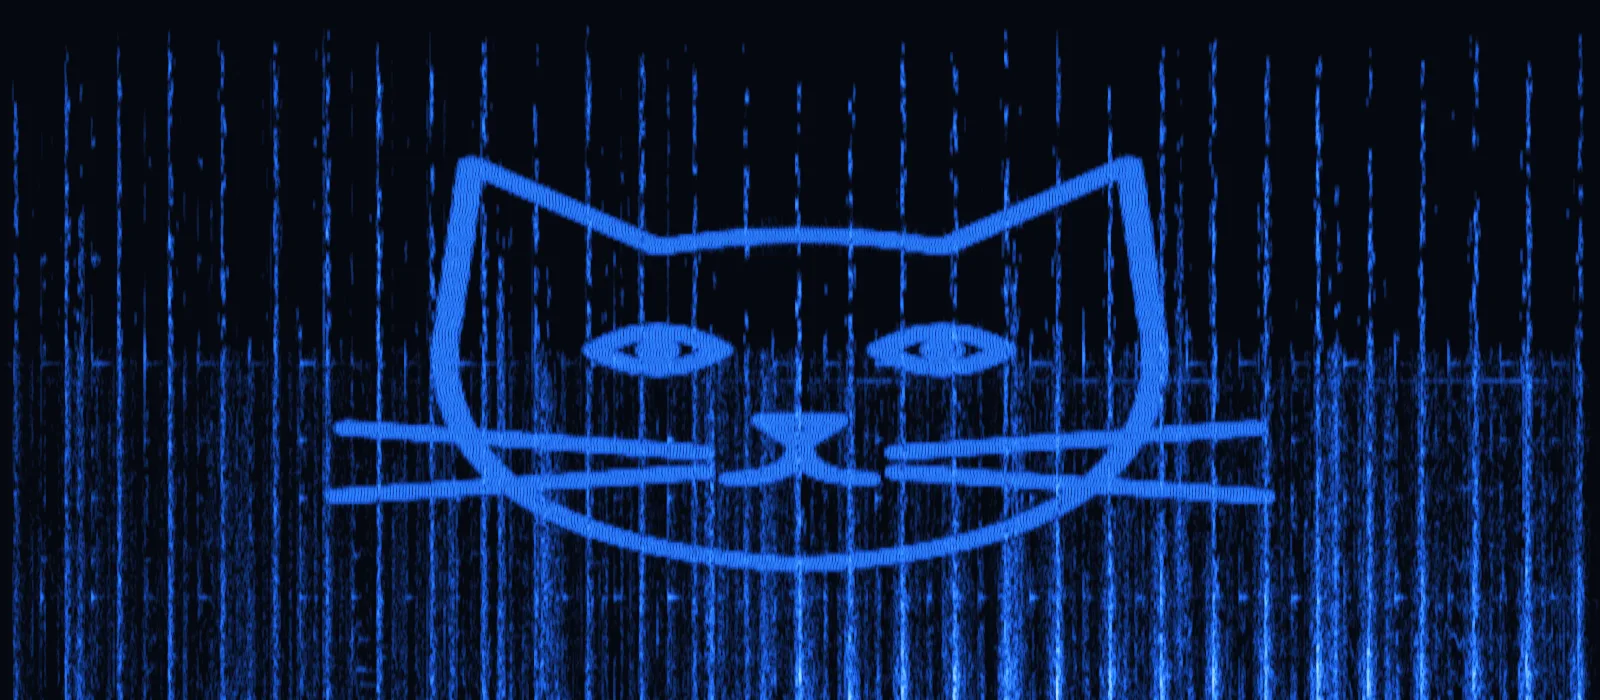
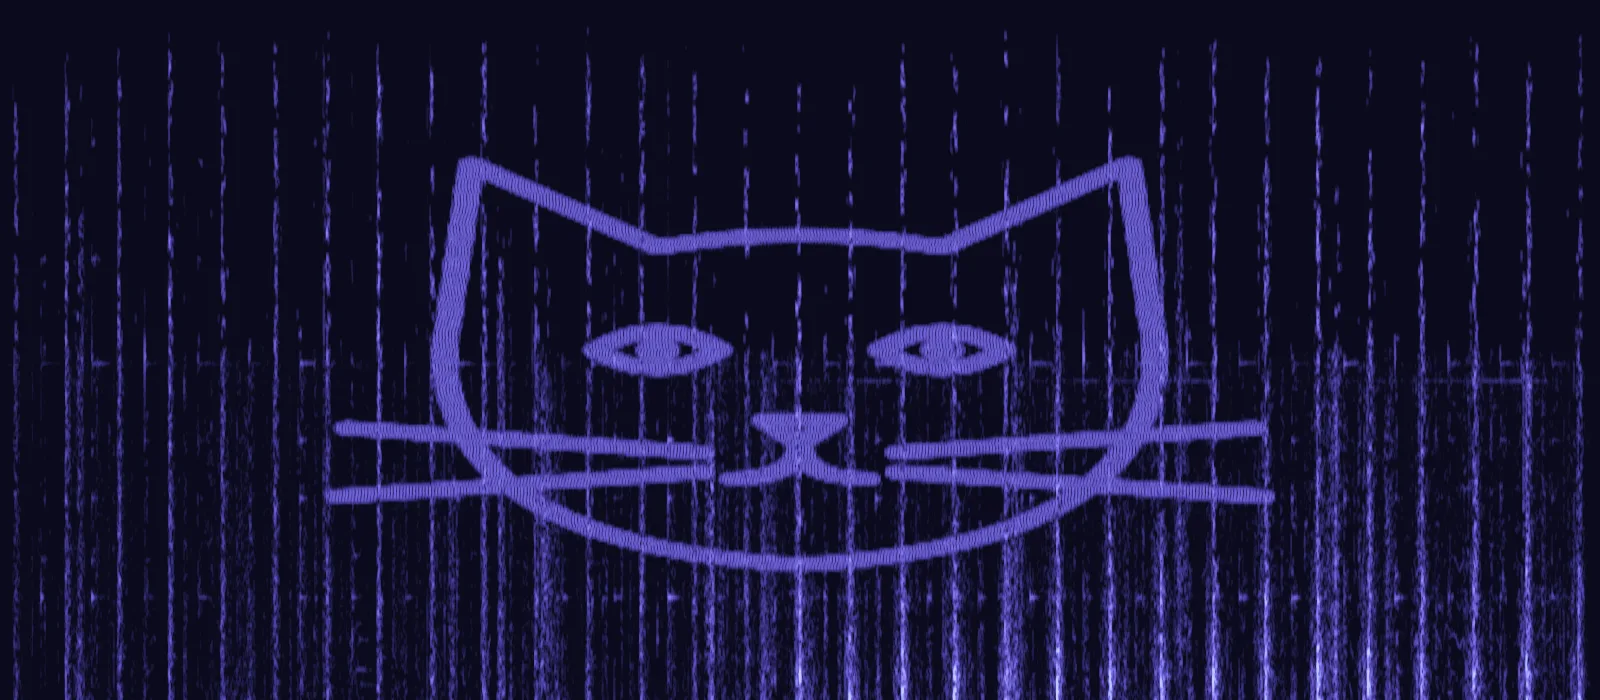
A cat hidden in a pop song
The full view shows a faint shape above the music. Narrow the window to 13–19 kHz and raise the contrast, and the drawing is plain to see. It sits 24 dB under the song, so you barely hear it.
- 13.5–18.5 kHz
- −24 dB
- MP3 320 kbps
- Ice

Typed text, decoded
“YOU FOUND IT” written with 140 tones between 2 and 9 kHz over 8 seconds. Magma, linear rows.
- 2–9 kHz
- 140 rows
- Linear
- Magma
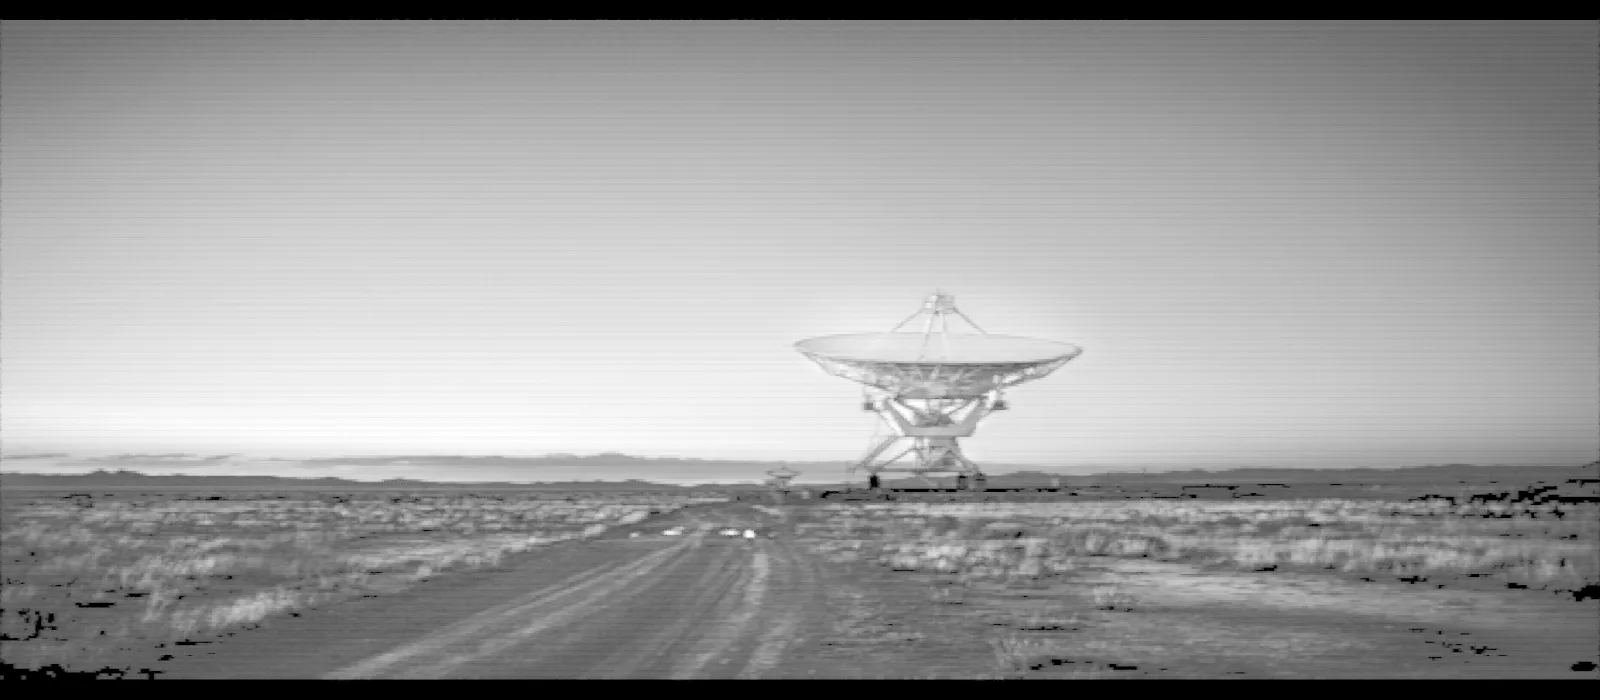
A photo, drawn with 300 tones
A radio-telescope photo as 300 sine waves from 1 to 16 kHz. Grayscale reads a photo best.
- 1–16 kHz
- 300 rows
- FFT 2048
- Grayscale
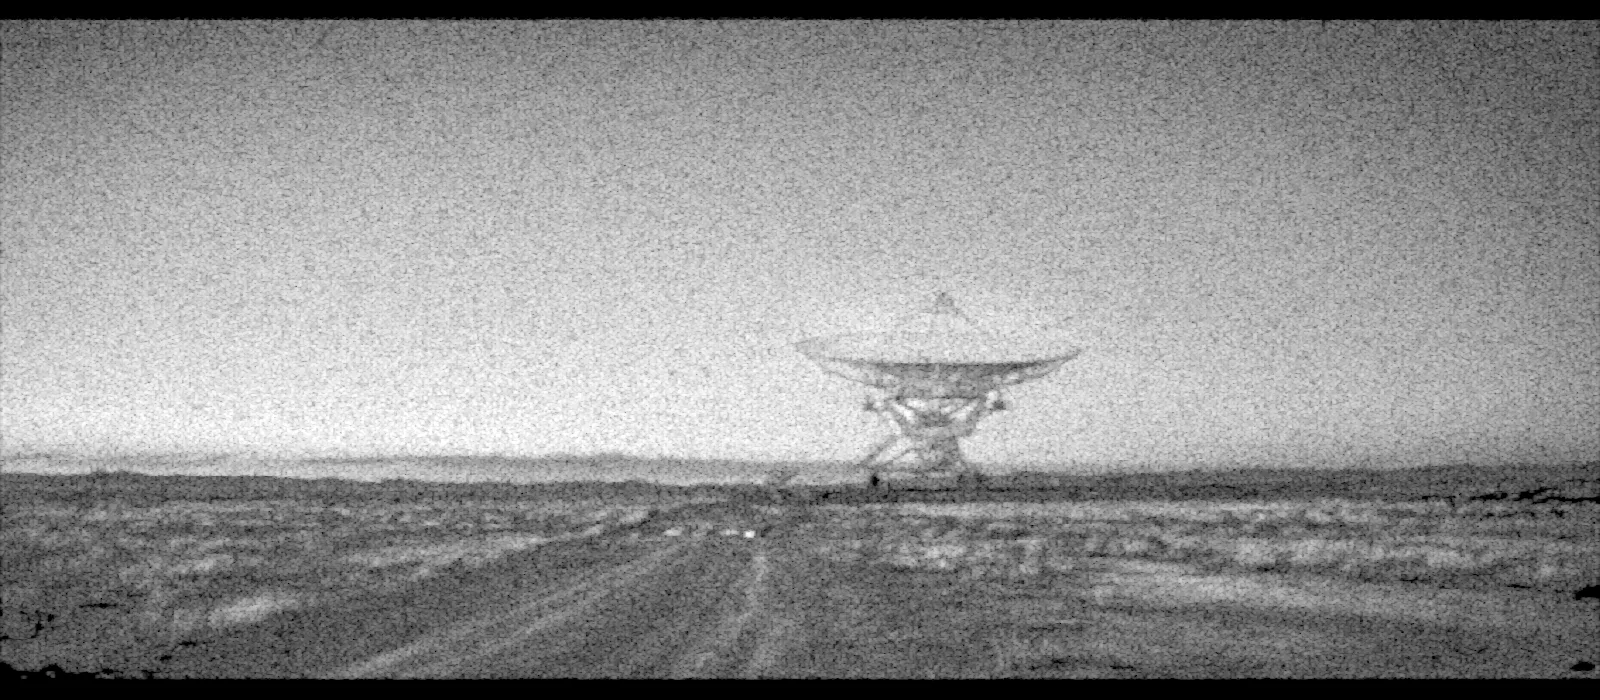
Same photo, noise method
Inverse STFT with random phase fills the gaps between rows, but the picture turns grainy.
- 1–16 kHz
- iSTFT
- FFT 2048
- Grayscale
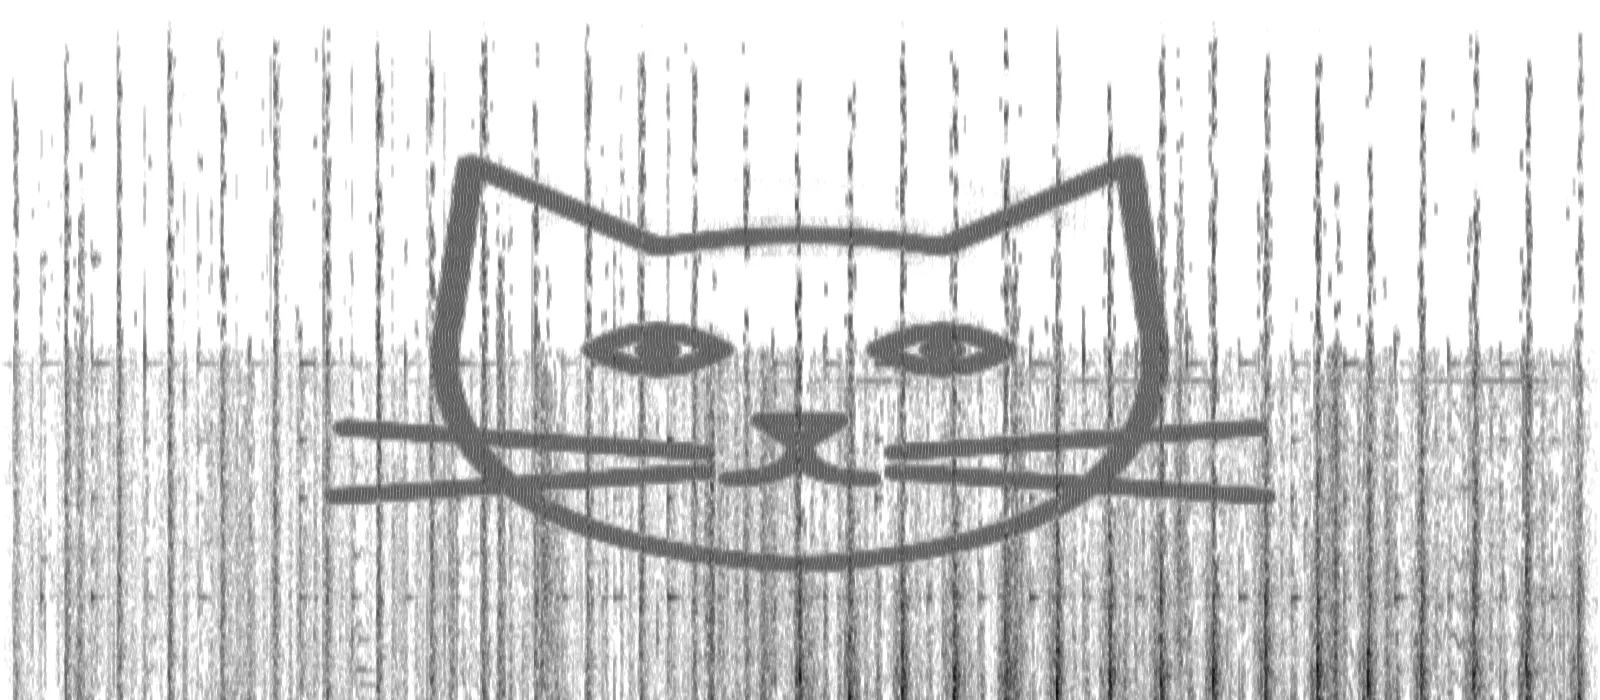
Inverted: ink on paper
Invert turns loud into dark. Line drawings and text often read better this way.
- 13–19 kHz
- Invert
- Grayscale

Wrong row spacing
The same text viewed with log rows: the top squeezes and the bottom stretches. Match the scale the picture was made with.
- 20 Hz – 11 kHz
- Log
- Magma
Want the usual view of a song, with notes and dB readouts? Use the online spectrogram. For a clean outline of the loudness instead, make a waveform image.
How it works
Find a hidden image in audio in three steps
Load the audio
Pick a demo clip or drop your file. A lossless WAV or FLAC keeps the most detail.
Zoom into the band
Drag a box over anything that looks drawn, or press Find picture. The upper band is the usual hiding place.
Tune and save
Raise the contrast, try invert or grayscale, then download the decoded picture as a PNG.
Settings
What each image spectrogram control does
A spectrogram turns sound into an image: time runs left to right, frequency bottom to top, loudness becomes brightness. These controls decide which part of that image you see.
Frequency window
- 0–22 kHz
- 12 kHz +
- Find picture
Brightness and contrast
- ±30 dB
- 110 → 20 dB
Linear or log rows
FFT size
- 1024 · 2048 · 4096
Invert and colour maps
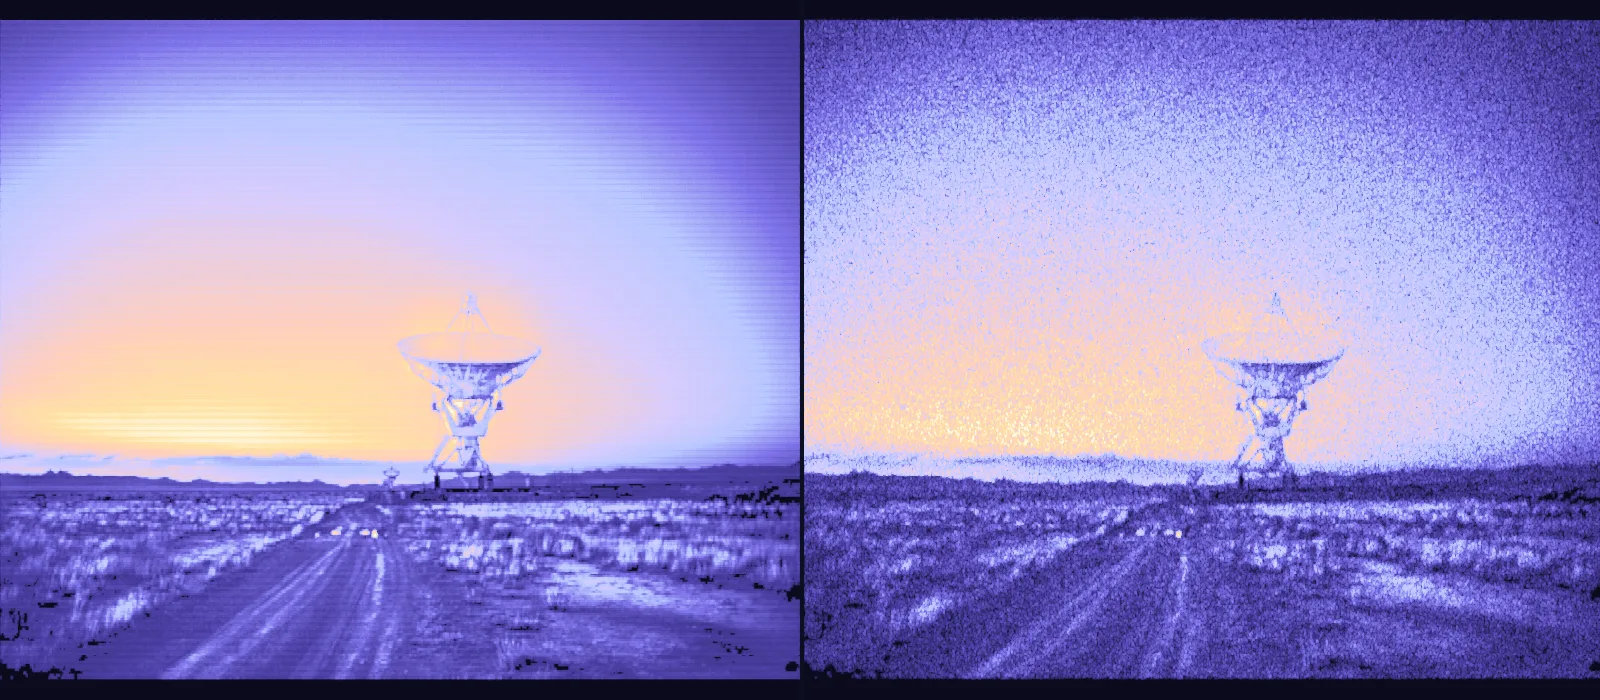
Image to sound: tones or noise
- Tones (sharp)
- Noise (soft)
Hide it in a track
- −40…−6 dB
- WAV
Use cases
Who decodes pictures in sound
From puzzle hunts to studio easter eggs, these are the usual reasons to open a spectrogram decoder.
Puzzle hunts and ARGs
Easter eggs in music
Radio and signal hobby
Send a secret message
Sound design

Teach how sound works
Photos: Unsplash (Unsplash License). Demo clips, the cat drawing and all spectrogram images: made with this tool.
Guide
How a hidden image in audio works — and where to look
A spectrogram slices sound into short frames and measures how loud every frequency is in each one. Plot the result and you get a picture. Turn that around and you can paint a picture first: make each row of pixels a frequency, play that frequency as loud as the pixel is bright, and the spectrogram draws your image back. That is all an image to sound encoder does.
Artists have used the trick for decades. Aphex Twin hid a face in his 1999 Windowlicker single, Nine Inch Nails tucked images into the Year Zero campaign in 2007, and Mick Gordon's Doom soundtrack from 2016 carries a pentagram and the number 666. Puzzle makers do the same with clues, which is why a spectrogram decoder is a standard tool in ARG communities.
When nothing shows up at first, work through the usual suspects. Start with the full view and the 12 kHz + preset. Raise the contrast until the background turns dark. Try log rows if the picture looks squashed at the top, and invert if it is text. If the file is an MP3 and the top of the image is missing, the encoder has already thrown that band away; ask for the WAV.
New to spectrograms? Read how to read a spectrogram first.
Where pictures usually hide
| Band | What you hear | Survives MP3? |
|---|---|---|
| 15–20 kHz | Faint whistle, inaudible to many adults | Often cut at 128–192 kbps |
| 5–15 kHz | Hiss or screech over the music | Yes, a little blurred |
| Below 2 kHz | Clearly audible, clashes with the music | Yes |
Making your own
FAQ
Spectrogram decoder questions
A spectrogram decoder draws a sound as a picture of frequency over time and gives you the controls to read what is drawn in it: a frequency window, brightness, contrast, invert and colour maps. If someone encoded an image into the audio, the decoder makes it visible.
Load the file, look at the full view, then try the 12 kHz + preset or Find picture. When you see a shape, drag a box around it to zoom and raise the contrast. Text often reads better inverted. Use the original WAV or FLAC if you can.
Yes. Switch to Image to sound, pick a picture or type text, choose the length and frequency band, and press the button. Each pixel row becomes a tone. Download the WAV, or hide the picture inside the demo song or your own track first.
MP3 encoders drop high frequencies to save space, often everything above about 16 kHz at 128–192 kbps, and they blur quiet detail. Keep hidden images below 15 kHz for MP3, or share the WAV.
Use the scale the picture was made with. Almost every hidden image is drawn on linear rows, which is also this encoder's default. On log rows such a picture looks squeezed at the top.
It is free with no signup and no watermark, with 10 PNG or WAV downloads a day; Pro lifts that limit and adds the 3000 px export. Decoding, encoding and the PNG and WAV exports all run in your browser, so your audio and pictures never leave your device.
Find the picture in your audio
Drop a file into the spectrogram decoder, or turn your own image into sound.
Free · no signup · no watermark · processed in your browser